Sudanese vs French Householder Income Over 65 years
COMPARE
Sudanese
French
Householder Income Over 65 years
Householder Income Over 65 years Comparison
Sudanese
French
$58,281
HOUSEHOLDER INCOME OVER 65 YEARS
5.7/ 100
METRIC RATING
217th/ 347
METRIC RANK
$59,656
HOUSEHOLDER INCOME OVER 65 YEARS
20.2/ 100
METRIC RATING
200th/ 347
METRIC RANK
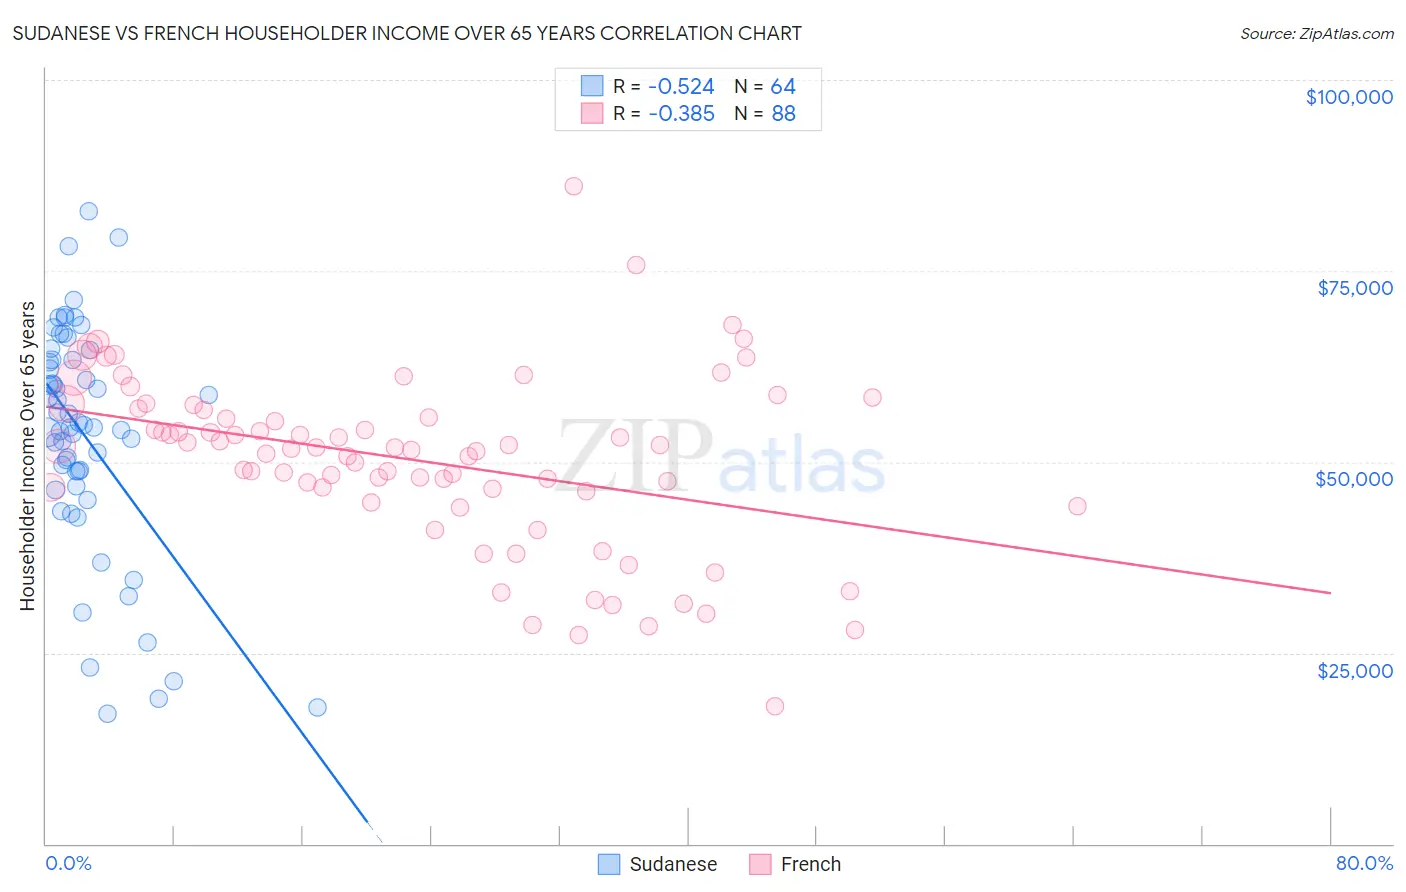
Sudanese vs French Householder Income Over 65 years Correlation Chart
The statistical analysis conducted on geographies consisting of 109,968,006 people shows a substantial negative correlation between the proportion of Sudanese and household income with householder over the age of 65 in the United States with a correlation coefficient (R) of -0.524 and weighted average of $58,281. Similarly, the statistical analysis conducted on geographies consisting of 567,058,353 people shows a mild negative correlation between the proportion of French and household income with householder over the age of 65 in the United States with a correlation coefficient (R) of -0.385 and weighted average of $59,656, a difference of 2.4%.
Householder Income Over 65 years Correlation Summary
| Measurement | Sudanese | French |
| Minimum | $17,083 | $18,036 |
| Maximum | $82,774 | $86,158 |
| Range | $65,691 | $68,122 |
| Mean | $53,447 | $50,230 |
| Median | $54,692 | $51,781 |
| Interquartile 25% (IQ1) | $47,752 | $46,316 |
| Interquartile 75% (IQ3) | $63,414 | $56,914 |
| Interquartile Range (IQR) | $15,662 | $10,598 |
| Standard Deviation (Sample) | $14,913 | $11,421 |
| Standard Deviation (Population) | $14,796 | $11,356 |
Demographics Similar to Sudanese and French by Householder Income Over 65 years
In terms of householder income over 65 years, the demographic groups most similar to Sudanese are Panamanian ($58,266, a difference of 0.030%), Immigrants from Middle Africa ($58,375, a difference of 0.16%), Immigrants from Ghana ($58,624, a difference of 0.59%), Nepalese ($58,761, a difference of 0.82%), and White/Caucasian ($58,847, a difference of 0.97%). Similarly, the demographic groups most similar to French are Immigrants ($59,656, a difference of 0.0%), Moroccan ($59,683, a difference of 0.050%), Dutch ($59,539, a difference of 0.20%), Finnish ($59,535, a difference of 0.20%), and Scotch-Irish ($59,447, a difference of 0.35%).
| Demographics | Rating | Rank | Householder Income Over 65 years |
| Moroccans | 20.7 /100 | #198 | Fair $59,683 |
| Immigrants | Immigrants | 20.2 /100 | #199 | Fair $59,656 |
| French | 20.2 /100 | #200 | Fair $59,656 |
| Dutch | 18.3 /100 | #201 | Poor $59,539 |
| Finns | 18.2 /100 | #202 | Poor $59,535 |
| Scotch-Irish | 16.9 /100 | #203 | Poor $59,447 |
| Arapaho | 16.0 /100 | #204 | Poor $59,383 |
| Immigrants | Sudan | 14.2 /100 | #205 | Poor $59,248 |
| Immigrants | South America | 13.0 /100 | #206 | Poor $59,151 |
| Salvadorans | 12.9 /100 | #207 | Poor $59,141 |
| Uruguayans | 12.3 /100 | #208 | Poor $59,090 |
| Slovaks | 11.7 /100 | #209 | Poor $59,039 |
| Nigerians | 11.2 /100 | #210 | Poor $58,992 |
| Immigrants | Nigeria | 10.7 /100 | #211 | Poor $58,942 |
| Colombians | 9.8 /100 | #212 | Tragic $58,851 |
| Whites/Caucasians | 9.8 /100 | #213 | Tragic $58,847 |
| Nepalese | 9.0 /100 | #214 | Tragic $58,761 |
| Immigrants | Ghana | 7.9 /100 | #215 | Tragic $58,624 |
| Immigrants | Middle Africa | 6.2 /100 | #216 | Tragic $58,375 |
| Sudanese | 5.7 /100 | #217 | Tragic $58,281 |
| Panamanians | 5.6 /100 | #218 | Tragic $58,266 |