Sudanese vs Immigrants from North America Householder Income Over 65 years
COMPARE
Sudanese
Immigrants from North America
Householder Income Over 65 years
Householder Income Over 65 years Comparison
Sudanese
Immigrants from North America
$58,281
HOUSEHOLDER INCOME OVER 65 YEARS
5.7/ 100
METRIC RATING
217th/ 347
METRIC RANK
$64,856
HOUSEHOLDER INCOME OVER 65 YEARS
98.3/ 100
METRIC RATING
80th/ 347
METRIC RANK
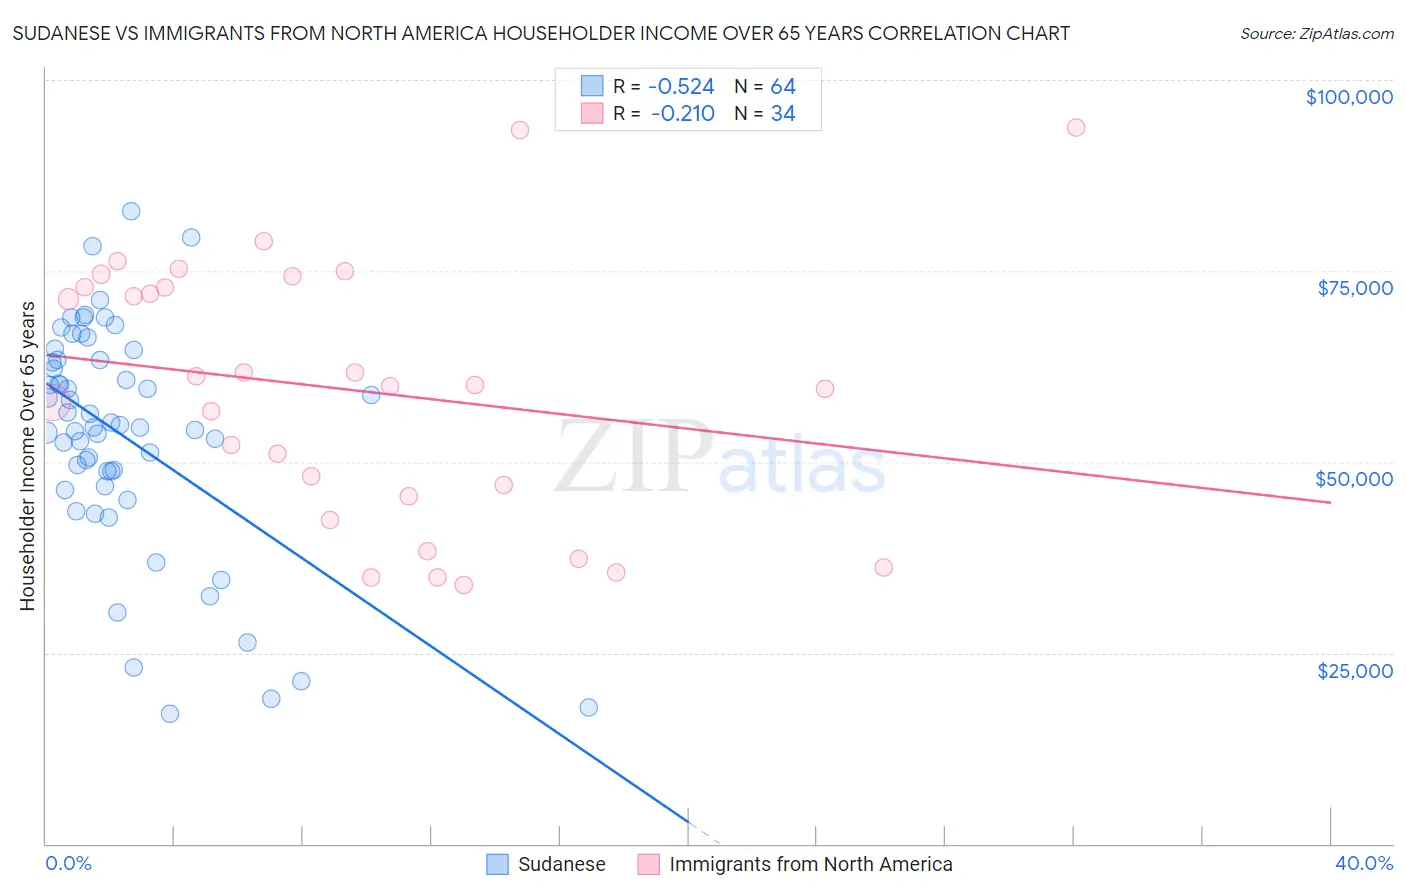
Sudanese vs Immigrants from North America Householder Income Over 65 years Correlation Chart
The statistical analysis conducted on geographies consisting of 109,968,006 people shows a substantial negative correlation between the proportion of Sudanese and household income with householder over the age of 65 in the United States with a correlation coefficient (R) of -0.524 and weighted average of $58,281. Similarly, the statistical analysis conducted on geographies consisting of 460,797,771 people shows a weak negative correlation between the proportion of Immigrants from North America and household income with householder over the age of 65 in the United States with a correlation coefficient (R) of -0.210 and weighted average of $64,856, a difference of 11.3%.
Householder Income Over 65 years Correlation Summary
| Measurement | Sudanese | Immigrants from North America |
| Minimum | $17,083 | $33,841 |
| Maximum | $82,774 | $93,750 |
| Range | $65,691 | $59,909 |
| Mean | $53,447 | $59,347 |
| Median | $54,692 | $59,957 |
| Interquartile 25% (IQ1) | $47,752 | $45,537 |
| Interquartile 75% (IQ3) | $63,414 | $72,906 |
| Interquartile Range (IQR) | $15,662 | $27,369 |
| Standard Deviation (Sample) | $14,913 | $17,042 |
| Standard Deviation (Population) | $14,796 | $16,789 |
Similar Demographics by Householder Income Over 65 years
Demographics Similar to Sudanese by Householder Income Over 65 years
In terms of householder income over 65 years, the demographic groups most similar to Sudanese are Panamanian ($58,266, a difference of 0.030%), Malaysian ($58,244, a difference of 0.060%), Yugoslavian ($58,243, a difference of 0.070%), Immigrants from El Salvador ($58,226, a difference of 0.10%), and Delaware ($58,214, a difference of 0.11%).
| Demographics | Rating | Rank | Householder Income Over 65 years |
| Nigerians | 11.2 /100 | #210 | Poor $58,992 |
| Immigrants | Nigeria | 10.7 /100 | #211 | Poor $58,942 |
| Colombians | 9.8 /100 | #212 | Tragic $58,851 |
| Whites/Caucasians | 9.8 /100 | #213 | Tragic $58,847 |
| Nepalese | 9.0 /100 | #214 | Tragic $58,761 |
| Immigrants | Ghana | 7.9 /100 | #215 | Tragic $58,624 |
| Immigrants | Middle Africa | 6.2 /100 | #216 | Tragic $58,375 |
| Sudanese | 5.7 /100 | #217 | Tragic $58,281 |
| Panamanians | 5.6 /100 | #218 | Tragic $58,266 |
| Malaysians | 5.5 /100 | #219 | Tragic $58,244 |
| Yugoslavians | 5.5 /100 | #220 | Tragic $58,243 |
| Immigrants | El Salvador | 5.4 /100 | #221 | Tragic $58,226 |
| Delaware | 5.3 /100 | #222 | Tragic $58,214 |
| Tsimshian | 5.2 /100 | #223 | Tragic $58,202 |
| Bermudans | 5.1 /100 | #224 | Tragic $58,171 |
Demographics Similar to Immigrants from North America by Householder Income Over 65 years
In terms of householder income over 65 years, the demographic groups most similar to Immigrants from North America are Immigrants from Europe ($64,828, a difference of 0.040%), Immigrants from Fiji ($64,795, a difference of 0.090%), Hawaiian ($64,920, a difference of 0.10%), Immigrants from Western Europe ($64,933, a difference of 0.12%), and Immigrants from Canada ($64,952, a difference of 0.15%).
| Demographics | Rating | Rank | Householder Income Over 65 years |
| Immigrants | Ethiopia | 98.9 /100 | #73 | Exceptional $65,238 |
| Lithuanians | 98.8 /100 | #74 | Exceptional $65,209 |
| Sierra Leoneans | 98.6 /100 | #75 | Exceptional $65,038 |
| Ethiopians | 98.5 /100 | #76 | Exceptional $64,989 |
| Immigrants | Canada | 98.5 /100 | #77 | Exceptional $64,952 |
| Immigrants | Western Europe | 98.5 /100 | #78 | Exceptional $64,933 |
| Hawaiians | 98.4 /100 | #79 | Exceptional $64,920 |
| Immigrants | North America | 98.3 /100 | #80 | Exceptional $64,856 |
| Immigrants | Europe | 98.3 /100 | #81 | Exceptional $64,828 |
| Immigrants | Fiji | 98.2 /100 | #82 | Exceptional $64,795 |
| Northern Europeans | 97.9 /100 | #83 | Exceptional $64,658 |
| Immigrants | Greece | 97.9 /100 | #84 | Exceptional $64,636 |
| Immigrants | Lebanon | 97.6 /100 | #85 | Exceptional $64,521 |
| Immigrants | Russia | 97.6 /100 | #86 | Exceptional $64,512 |
| Austrians | 97.5 /100 | #87 | Exceptional $64,470 |