Sudanese vs Turkish Median Male Earnings
COMPARE
Sudanese
Turkish
Median Male Earnings
Median Male Earnings Comparison
Sudanese
Turks
$51,216
MEDIAN MALE EARNINGS
3.9/ 100
METRIC RATING
232nd/ 347
METRIC RANK
$64,253
MEDIAN MALE EARNINGS
100.0/ 100
METRIC RATING
26th/ 347
METRIC RANK
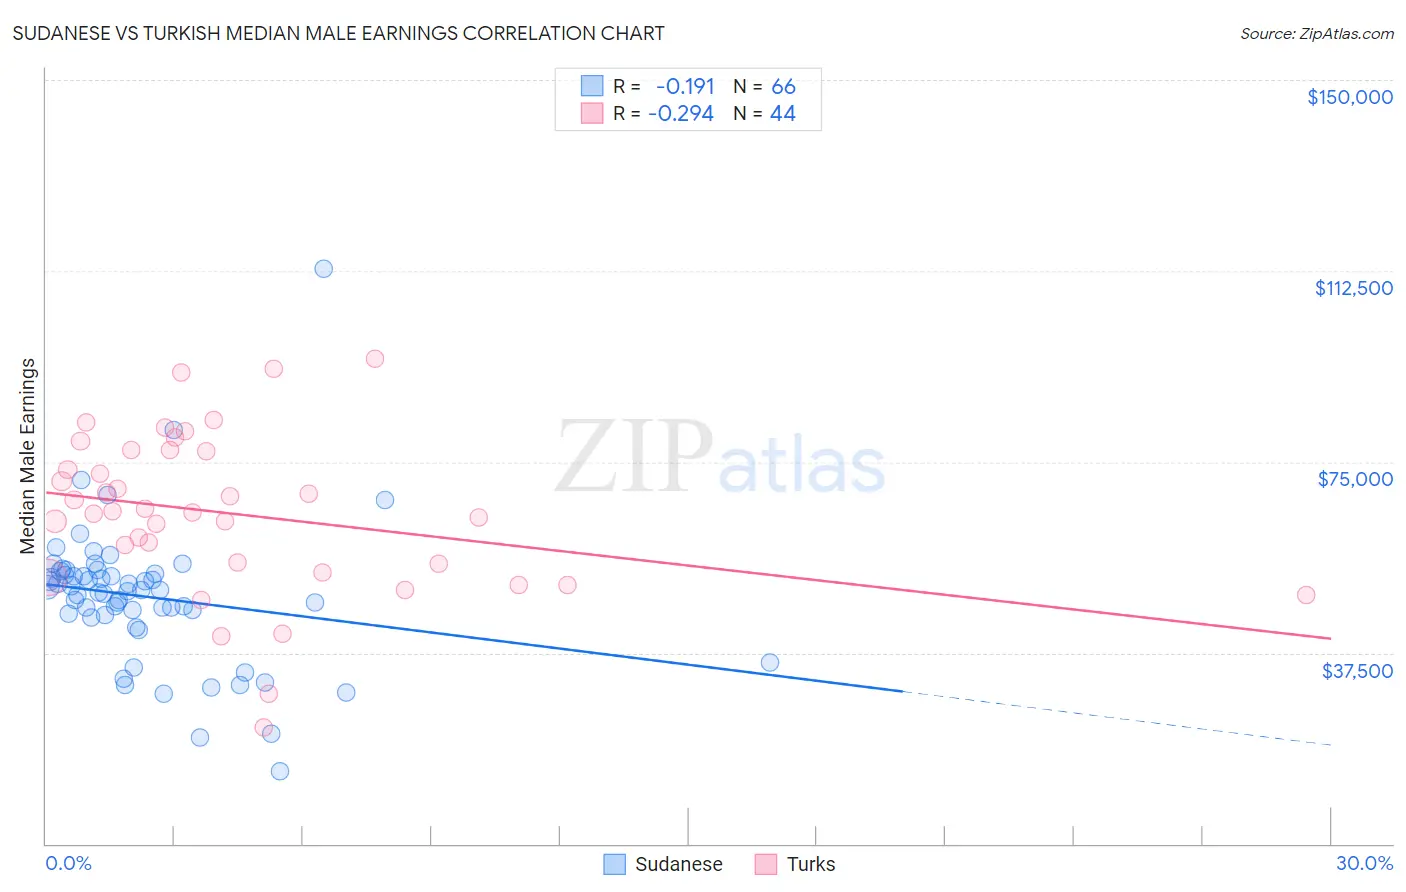
Sudanese vs Turkish Median Male Earnings Correlation Chart
The statistical analysis conducted on geographies consisting of 110,150,959 people shows a poor negative correlation between the proportion of Sudanese and median male earnings in the United States with a correlation coefficient (R) of -0.191 and weighted average of $51,216. Similarly, the statistical analysis conducted on geographies consisting of 271,821,901 people shows a weak negative correlation between the proportion of Turks and median male earnings in the United States with a correlation coefficient (R) of -0.294 and weighted average of $64,253, a difference of 25.5%.
Median Male Earnings Correlation Summary
| Measurement | Sudanese | Turkish |
| Minimum | $14,310 | $22,917 |
| Maximum | $113,008 | $95,313 |
| Range | $98,698 | $72,396 |
| Mean | $48,489 | $64,813 |
| Median | $49,650 | $65,160 |
| Interquartile 25% (IQ1) | $44,972 | $54,093 |
| Interquartile 75% (IQ3) | $53,130 | $77,144 |
| Interquartile Range (IQR) | $8,158 | $23,051 |
| Standard Deviation (Sample) | $14,082 | $15,821 |
| Standard Deviation (Population) | $13,975 | $15,640 |
Similar Demographics by Median Male Earnings
Demographics Similar to Sudanese by Median Male Earnings
In terms of median male earnings, the demographic groups most similar to Sudanese are Barbadian ($51,236, a difference of 0.040%), Aleut ($51,168, a difference of 0.090%), Immigrants from Nigeria ($51,310, a difference of 0.18%), Cape Verdean ($51,103, a difference of 0.22%), and Immigrants from Trinidad and Tobago ($51,376, a difference of 0.31%).
| Demographics | Rating | Rank | Median Male Earnings |
| Immigrants | Sudan | 5.0 /100 | #225 | Tragic $51,489 |
| Japanese | 4.9 /100 | #226 | Tragic $51,473 |
| Trinidadians and Tobagonians | 4.8 /100 | #227 | Tragic $51,446 |
| Samoans | 4.6 /100 | #228 | Tragic $51,389 |
| Immigrants | Trinidad and Tobago | 4.5 /100 | #229 | Tragic $51,376 |
| Immigrants | Nigeria | 4.2 /100 | #230 | Tragic $51,310 |
| Barbadians | 3.9 /100 | #231 | Tragic $51,236 |
| Sudanese | 3.9 /100 | #232 | Tragic $51,216 |
| Aleuts | 3.7 /100 | #233 | Tragic $51,168 |
| Cape Verdeans | 3.5 /100 | #234 | Tragic $51,103 |
| Immigrants | Western Africa | 3.0 /100 | #235 | Tragic $50,940 |
| Pennsylvania Germans | 2.8 /100 | #236 | Tragic $50,878 |
| Immigrants | Barbados | 2.6 /100 | #237 | Tragic $50,795 |
| Malaysians | 2.5 /100 | #238 | Tragic $50,772 |
| Americans | 2.5 /100 | #239 | Tragic $50,761 |
Demographics Similar to Turks by Median Male Earnings
In terms of median male earnings, the demographic groups most similar to Turks are Immigrants from Switzerland ($63,944, a difference of 0.48%), Russian ($63,939, a difference of 0.49%), Immigrants from Denmark ($64,625, a difference of 0.58%), Asian ($63,827, a difference of 0.67%), and Immigrants from France ($63,715, a difference of 0.84%).
| Demographics | Rating | Rank | Median Male Earnings |
| Cypriots | 100.0 /100 | #19 | Exceptional $65,549 |
| Immigrants | Japan | 100.0 /100 | #20 | Exceptional $65,518 |
| Immigrants | Sweden | 100.0 /100 | #21 | Exceptional $65,406 |
| Burmese | 100.0 /100 | #22 | Exceptional $65,236 |
| Immigrants | Korea | 100.0 /100 | #23 | Exceptional $65,079 |
| Immigrants | Northern Europe | 100.0 /100 | #24 | Exceptional $64,987 |
| Immigrants | Denmark | 100.0 /100 | #25 | Exceptional $64,625 |
| Turks | 100.0 /100 | #26 | Exceptional $64,253 |
| Immigrants | Switzerland | 100.0 /100 | #27 | Exceptional $63,944 |
| Russians | 100.0 /100 | #28 | Exceptional $63,939 |
| Asians | 100.0 /100 | #29 | Exceptional $63,827 |
| Immigrants | France | 100.0 /100 | #30 | Exceptional $63,715 |
| Latvians | 100.0 /100 | #31 | Exceptional $63,498 |
| Soviet Union | 100.0 /100 | #32 | Exceptional $63,382 |
| Immigrants | Lithuania | 100.0 /100 | #33 | Exceptional $63,346 |