Spanish American Indian vs Cambodian Householder Income Ages 25 - 44 years
COMPARE
Spanish American Indian
Cambodian
Householder Income Ages 25 - 44 years
Householder Income Ages 25 - 44 years Comparison
Spanish American Indians
Cambodians
$84,085
HOUSEHOLDER INCOME AGES 25 - 44 YEARS
0.3/ 100
METRIC RATING
269th/ 347
METRIC RANK
$107,148
HOUSEHOLDER INCOME AGES 25 - 44 YEARS
99.9/ 100
METRIC RATING
50th/ 347
METRIC RANK
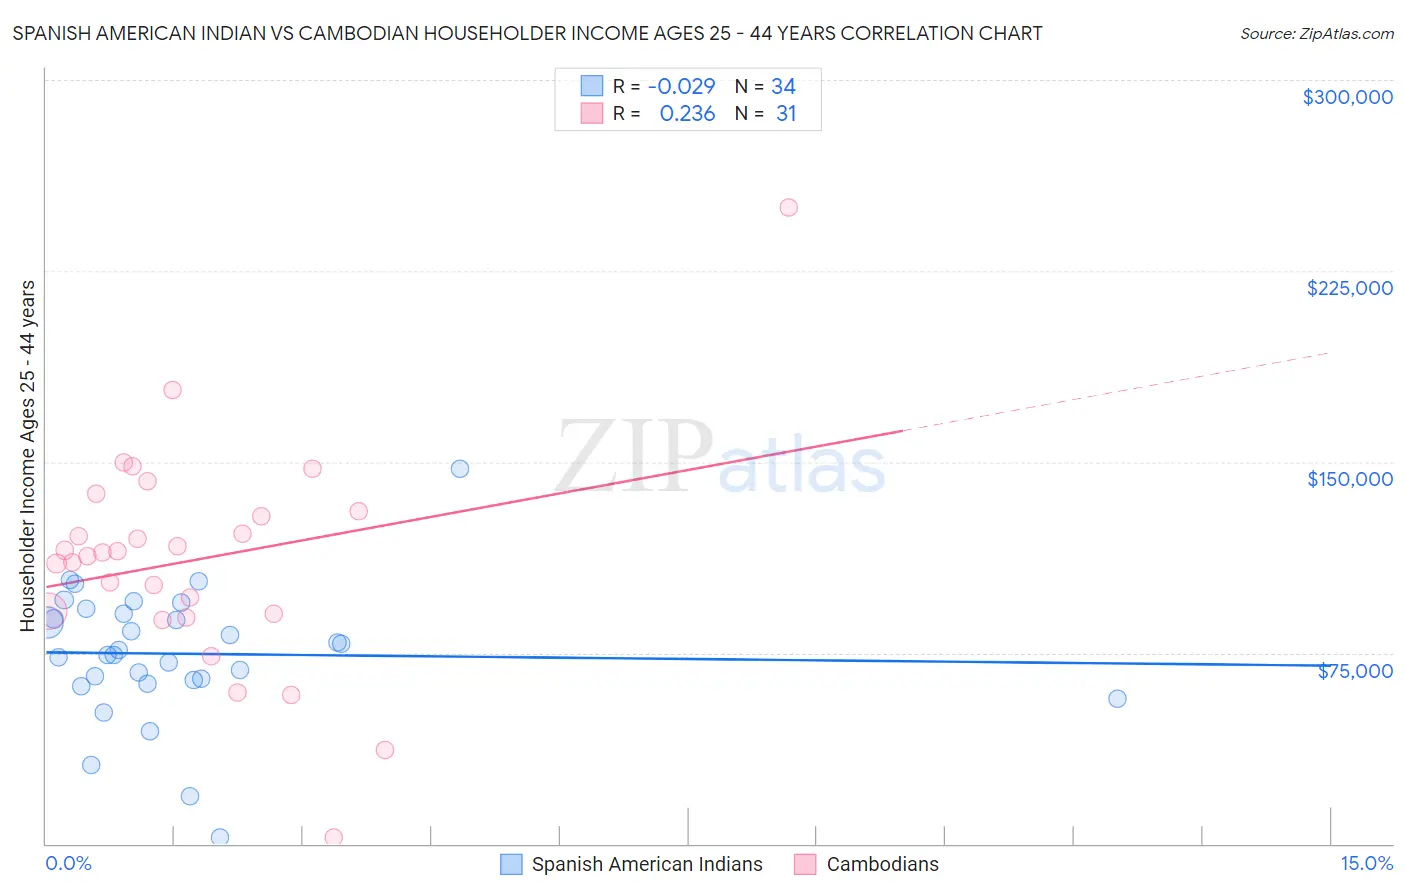
Spanish American Indian vs Cambodian Householder Income Ages 25 - 44 years Correlation Chart
The statistical analysis conducted on geographies consisting of 73,137,186 people shows no correlation between the proportion of Spanish American Indians and household income with householder between the ages 25 and 44 in the United States with a correlation coefficient (R) of -0.029 and weighted average of $84,085. Similarly, the statistical analysis conducted on geographies consisting of 102,421,447 people shows a weak positive correlation between the proportion of Cambodians and household income with householder between the ages 25 and 44 in the United States with a correlation coefficient (R) of 0.236 and weighted average of $107,148, a difference of 27.4%.
Householder Income Ages 25 - 44 years Correlation Summary
| Measurement | Spanish American Indian | Cambodian |
| Minimum | $2,499 | $2,499 |
| Maximum | $147,500 | $250,001 |
| Range | $145,001 | $247,502 |
| Mean | $74,648 | $111,649 |
| Median | $75,146 | $114,305 |
| Interquartile 25% (IQ1) | $64,148 | $90,341 |
| Interquartile 75% (IQ3) | $90,277 | $130,756 |
| Interquartile Range (IQR) | $26,129 | $40,415 |
| Standard Deviation (Sample) | $26,399 | $43,612 |
| Standard Deviation (Population) | $26,008 | $42,903 |
Similar Demographics by Householder Income Ages 25 - 44 years
Demographics Similar to Spanish American Indians by Householder Income Ages 25 - 44 years
In terms of householder income ages 25 - 44 years, the demographic groups most similar to Spanish American Indians are Subsaharan African ($84,235, a difference of 0.18%), Jamaican ($83,933, a difference of 0.18%), Hmong ($84,258, a difference of 0.21%), Immigrants from Cabo Verde ($84,304, a difference of 0.26%), and Sudanese ($84,401, a difference of 0.38%).
| Demographics | Rating | Rank | Householder Income Ages 25 - 44 years |
| Cree | 0.4 /100 | #262 | Tragic $84,574 |
| Belizeans | 0.4 /100 | #263 | Tragic $84,534 |
| Osage | 0.4 /100 | #264 | Tragic $84,461 |
| Sudanese | 0.4 /100 | #265 | Tragic $84,401 |
| Immigrants | Cabo Verde | 0.3 /100 | #266 | Tragic $84,304 |
| Hmong | 0.3 /100 | #267 | Tragic $84,258 |
| Sub-Saharan Africans | 0.3 /100 | #268 | Tragic $84,235 |
| Spanish American Indians | 0.3 /100 | #269 | Tragic $84,085 |
| Jamaicans | 0.3 /100 | #270 | Tragic $83,933 |
| Somalis | 0.2 /100 | #271 | Tragic $83,752 |
| Spanish Americans | 0.2 /100 | #272 | Tragic $83,722 |
| Iroquois | 0.2 /100 | #273 | Tragic $83,682 |
| Marshallese | 0.2 /100 | #274 | Tragic $83,575 |
| Immigrants | Jamaica | 0.2 /100 | #275 | Tragic $83,298 |
| Immigrants | Belize | 0.2 /100 | #276 | Tragic $83,141 |
Demographics Similar to Cambodians by Householder Income Ages 25 - 44 years
In terms of householder income ages 25 - 44 years, the demographic groups most similar to Cambodians are Immigrants from Turkey ($107,258, a difference of 0.10%), Estonian ($107,269, a difference of 0.11%), Bulgarian ($107,264, a difference of 0.11%), Immigrants from Belarus ($107,393, a difference of 0.23%), and Immigrants from Czechoslovakia ($106,888, a difference of 0.24%).
| Demographics | Rating | Rank | Householder Income Ages 25 - 44 years |
| Immigrants | Malaysia | 99.9 /100 | #43 | Exceptional $107,650 |
| Immigrants | Indonesia | 99.9 /100 | #44 | Exceptional $107,627 |
| Israelis | 99.9 /100 | #45 | Exceptional $107,579 |
| Immigrants | Belarus | 99.9 /100 | #46 | Exceptional $107,393 |
| Estonians | 99.9 /100 | #47 | Exceptional $107,269 |
| Bulgarians | 99.9 /100 | #48 | Exceptional $107,264 |
| Immigrants | Turkey | 99.9 /100 | #49 | Exceptional $107,258 |
| Cambodians | 99.9 /100 | #50 | Exceptional $107,148 |
| Immigrants | Czechoslovakia | 99.9 /100 | #51 | Exceptional $106,888 |
| Immigrants | Europe | 99.9 /100 | #52 | Exceptional $106,817 |
| Immigrants | Norway | 99.9 /100 | #53 | Exceptional $106,629 |
| Paraguayans | 99.9 /100 | #54 | Exceptional $106,615 |
| Greeks | 99.9 /100 | #55 | Exceptional $106,457 |
| Immigrants | Pakistan | 99.8 /100 | #56 | Exceptional $106,129 |
| Immigrants | Austria | 99.8 /100 | #57 | Exceptional $106,103 |