Spanish American vs Senegalese Householder Income Under 25 years
COMPARE
Spanish American
Senegalese
Householder Income Under 25 years
Householder Income Under 25 years Comparison
Spanish Americans
Senegalese
$46,913
HOUSEHOLDER INCOME UNDER 25 YEARS
0.0/ 100
METRIC RATING
318th/ 347
METRIC RANK
$48,953
HOUSEHOLDER INCOME UNDER 25 YEARS
0.0/ 100
METRIC RATING
287th/ 347
METRIC RANK
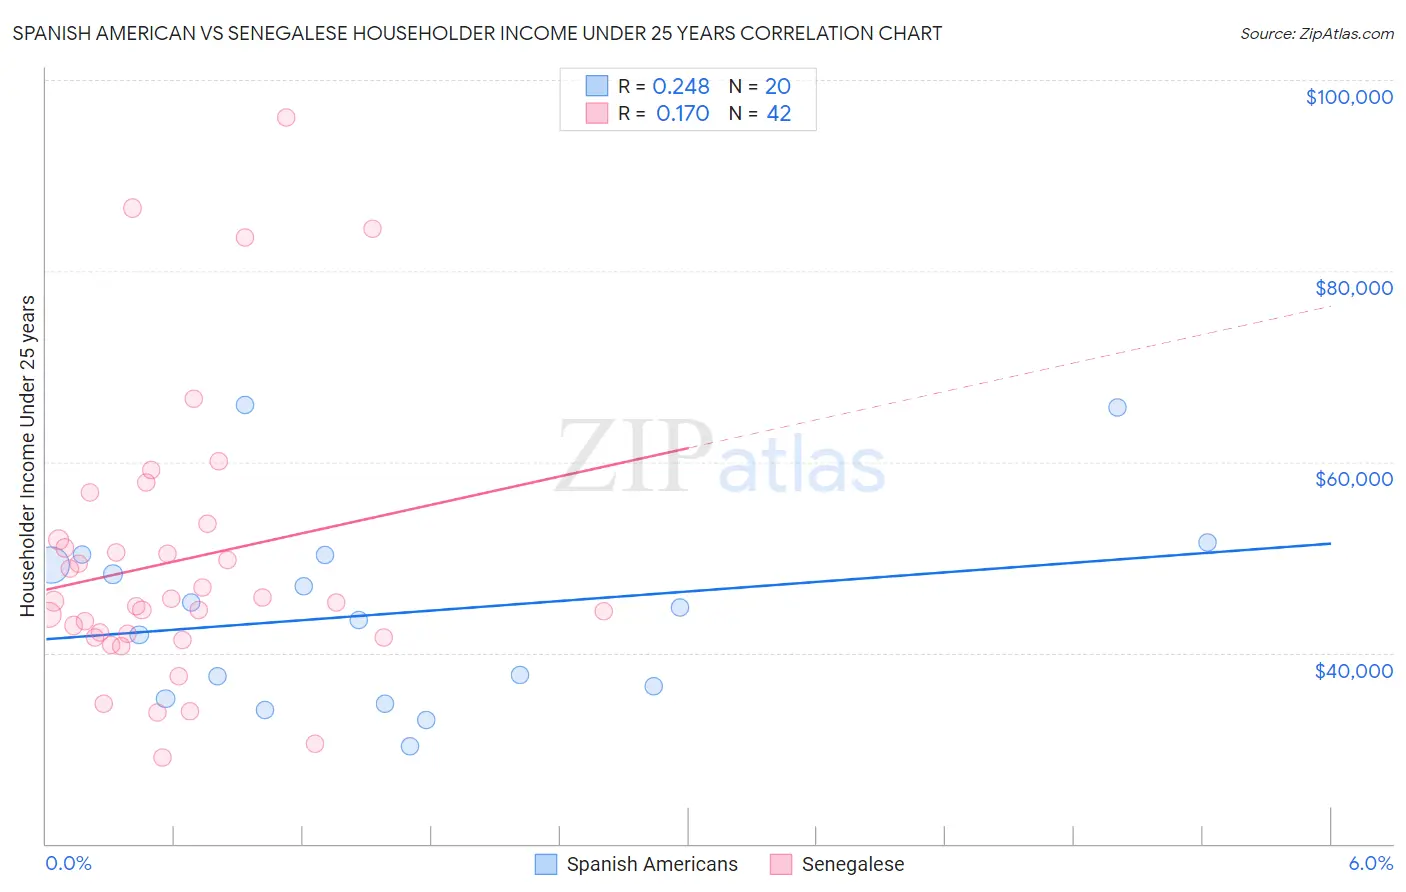
Spanish American vs Senegalese Householder Income Under 25 years Correlation Chart
The statistical analysis conducted on geographies consisting of 97,599,501 people shows a weak positive correlation between the proportion of Spanish Americans and household income with householder under the age of 25 in the United States with a correlation coefficient (R) of 0.248 and weighted average of $46,913. Similarly, the statistical analysis conducted on geographies consisting of 74,236,071 people shows a poor positive correlation between the proportion of Senegalese and household income with householder under the age of 25 in the United States with a correlation coefficient (R) of 0.170 and weighted average of $48,953, a difference of 4.3%.
Householder Income Under 25 years Correlation Summary
| Measurement | Spanish American | Senegalese |
| Minimum | $30,224 | $29,051 |
| Maximum | $65,953 | $96,121 |
| Range | $35,729 | $67,070 |
| Mean | $44,130 | $49,594 |
| Median | $44,094 | $45,365 |
| Interquartile 25% (IQ1) | $35,845 | $41,620 |
| Interquartile 75% (IQ3) | $49,764 | $51,815 |
| Interquartile Range (IQR) | $13,919 | $10,195 |
| Standard Deviation (Sample) | $9,911 | $14,774 |
| Standard Deviation (Population) | $9,660 | $14,597 |
Similar Demographics by Householder Income Under 25 years
Demographics Similar to Spanish Americans by Householder Income Under 25 years
In terms of householder income under 25 years, the demographic groups most similar to Spanish Americans are Hopi ($46,978, a difference of 0.14%), Sudanese ($46,982, a difference of 0.15%), African ($46,838, a difference of 0.16%), Crow ($47,012, a difference of 0.21%), and Chippewa ($47,015, a difference of 0.22%).
| Demographics | Rating | Rank | Householder Income Under 25 years |
| Ottawa | 0.0 /100 | #311 | Tragic $47,366 |
| Bermudans | 0.0 /100 | #312 | Tragic $47,359 |
| Delaware | 0.0 /100 | #313 | Tragic $47,159 |
| Chippewa | 0.0 /100 | #314 | Tragic $47,015 |
| Crow | 0.0 /100 | #315 | Tragic $47,012 |
| Sudanese | 0.0 /100 | #316 | Tragic $46,982 |
| Hopi | 0.0 /100 | #317 | Tragic $46,978 |
| Spanish Americans | 0.0 /100 | #318 | Tragic $46,913 |
| Africans | 0.0 /100 | #319 | Tragic $46,838 |
| Immigrants | Sudan | 0.0 /100 | #320 | Tragic $46,791 |
| Potawatomi | 0.0 /100 | #321 | Tragic $46,462 |
| Sioux | 0.0 /100 | #322 | Tragic $46,417 |
| Immigrants | Saudi Arabia | 0.0 /100 | #323 | Tragic $46,187 |
| Dutch West Indians | 0.0 /100 | #324 | Tragic $45,816 |
| Immigrants | Bahamas | 0.0 /100 | #325 | Tragic $45,793 |
Demographics Similar to Senegalese by Householder Income Under 25 years
In terms of householder income under 25 years, the demographic groups most similar to Senegalese are French American Indian ($48,977, a difference of 0.050%), Liberian ($48,917, a difference of 0.070%), Honduran ($48,885, a difference of 0.14%), Scotch-Irish ($49,039, a difference of 0.18%), and American ($48,860, a difference of 0.19%).
| Demographics | Rating | Rank | Householder Income Under 25 years |
| Hmong | 0.1 /100 | #280 | Tragic $49,364 |
| Immigrants | Nonimmigrants | 0.1 /100 | #281 | Tragic $49,348 |
| Alsatians | 0.1 /100 | #282 | Tragic $49,267 |
| Immigrants | Nigeria | 0.1 /100 | #283 | Tragic $49,174 |
| Carpatho Rusyns | 0.1 /100 | #284 | Tragic $49,113 |
| Scotch-Irish | 0.0 /100 | #285 | Tragic $49,039 |
| French American Indians | 0.0 /100 | #286 | Tragic $48,977 |
| Senegalese | 0.0 /100 | #287 | Tragic $48,953 |
| Liberians | 0.0 /100 | #288 | Tragic $48,917 |
| Hondurans | 0.0 /100 | #289 | Tragic $48,885 |
| Americans | 0.0 /100 | #290 | Tragic $48,860 |
| Immigrants | Burma/Myanmar | 0.0 /100 | #291 | Tragic $48,749 |
| Shoshone | 0.0 /100 | #292 | Tragic $48,720 |
| Sub-Saharan Africans | 0.0 /100 | #293 | Tragic $48,691 |
| Somalis | 0.0 /100 | #294 | Tragic $48,657 |