Romanian vs Soviet Union Householder Income Under 25 years
COMPARE
Romanian
Soviet Union
Householder Income Under 25 years
Householder Income Under 25 years Comparison
Romanians
Soviet Union
$53,632
HOUSEHOLDER INCOME UNDER 25 YEARS
97.2/ 100
METRIC RATING
113th/ 347
METRIC RANK
$55,340
HOUSEHOLDER INCOME UNDER 25 YEARS
100.0/ 100
METRIC RATING
57th/ 347
METRIC RANK
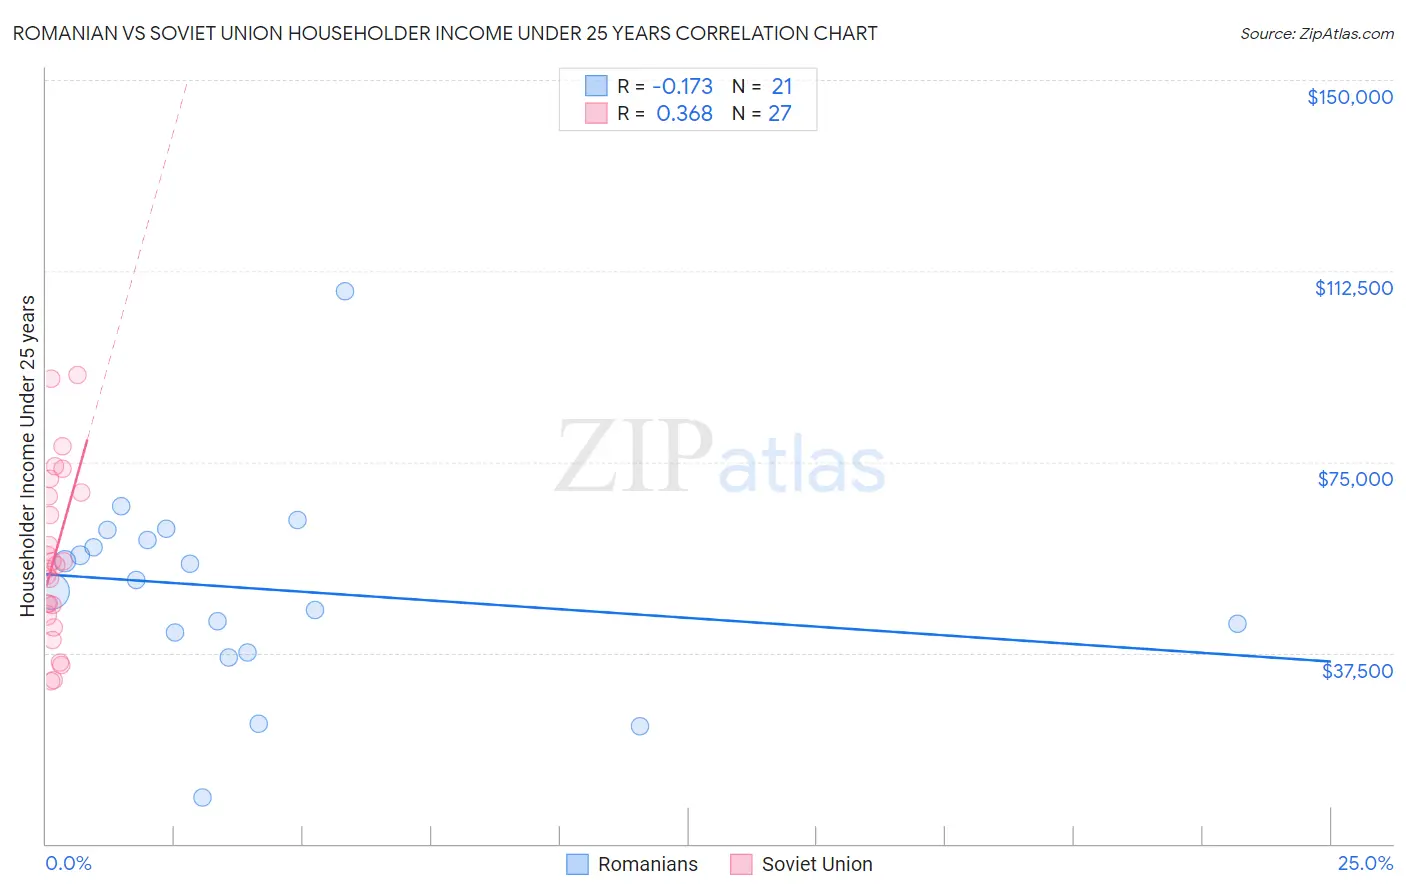
Romanian vs Soviet Union Householder Income Under 25 years Correlation Chart
The statistical analysis conducted on geographies consisting of 317,146,706 people shows a poor negative correlation between the proportion of Romanians and household income with householder under the age of 25 in the United States with a correlation coefficient (R) of -0.173 and weighted average of $53,632. Similarly, the statistical analysis conducted on geographies consisting of 41,172,348 people shows a mild positive correlation between the proportion of Soviet Union and household income with householder under the age of 25 in the United States with a correlation coefficient (R) of 0.368 and weighted average of $55,340, a difference of 3.2%.
Householder Income Under 25 years Correlation Summary
| Measurement | Romanian | Soviet Union |
| Minimum | $9,000 | $31,928 |
| Maximum | $108,452 | $92,155 |
| Range | $99,452 | $60,227 |
| Mean | $50,147 | $56,535 |
| Median | $51,890 | $54,732 |
| Interquartile 25% (IQ1) | $39,493 | $44,839 |
| Interquartile 75% (IQ3) | $60,663 | $69,000 |
| Interquartile Range (IQR) | $21,170 | $24,161 |
| Standard Deviation (Sample) | $20,018 | $16,589 |
| Standard Deviation (Population) | $19,536 | $16,279 |
Similar Demographics by Householder Income Under 25 years
Demographics Similar to Romanians by Householder Income Under 25 years
In terms of householder income under 25 years, the demographic groups most similar to Romanians are Immigrants from Sweden ($53,621, a difference of 0.020%), Immigrants from Albania ($53,597, a difference of 0.070%), Immigrants from Oceania ($53,680, a difference of 0.090%), Immigrants from Spain ($53,560, a difference of 0.14%), and Greek ($53,715, a difference of 0.15%).
| Demographics | Rating | Rank | Householder Income Under 25 years |
| Albanians | 98.1 /100 | #106 | Exceptional $53,794 |
| Australians | 97.8 /100 | #107 | Exceptional $53,739 |
| Maltese | 97.8 /100 | #108 | Exceptional $53,735 |
| Immigrants | Ecuador | 97.7 /100 | #109 | Exceptional $53,722 |
| Greeks | 97.7 /100 | #110 | Exceptional $53,715 |
| Immigrants | Colombia | 97.7 /100 | #111 | Exceptional $53,714 |
| Immigrants | Oceania | 97.5 /100 | #112 | Exceptional $53,680 |
| Romanians | 97.2 /100 | #113 | Exceptional $53,632 |
| Immigrants | Sweden | 97.1 /100 | #114 | Exceptional $53,621 |
| Immigrants | Albania | 96.9 /100 | #115 | Exceptional $53,597 |
| Immigrants | Spain | 96.6 /100 | #116 | Exceptional $53,560 |
| Lithuanians | 96.6 /100 | #117 | Exceptional $53,552 |
| Immigrants | Switzerland | 96.3 /100 | #118 | Exceptional $53,528 |
| Italians | 95.4 /100 | #119 | Exceptional $53,426 |
| Guamanians/Chamorros | 95.3 /100 | #120 | Exceptional $53,423 |
Demographics Similar to Soviet Union by Householder Income Under 25 years
In terms of householder income under 25 years, the demographic groups most similar to Soviet Union are Salvadoran ($55,412, a difference of 0.13%), Immigrants from Ukraine ($55,447, a difference of 0.19%), Immigrants from Poland ($55,474, a difference of 0.24%), Sri Lankan ($55,470, a difference of 0.24%), and Guyanese ($55,210, a difference of 0.24%).
| Demographics | Rating | Rank | Householder Income Under 25 years |
| Puget Sound Salish | 100.0 /100 | #50 | Exceptional $55,543 |
| Immigrants | Romania | 100.0 /100 | #51 | Exceptional $55,522 |
| Immigrants | Indonesia | 100.0 /100 | #52 | Exceptional $55,521 |
| Immigrants | Poland | 100.0 /100 | #53 | Exceptional $55,474 |
| Sri Lankans | 100.0 /100 | #54 | Exceptional $55,470 |
| Immigrants | Ukraine | 100.0 /100 | #55 | Exceptional $55,447 |
| Salvadorans | 100.0 /100 | #56 | Exceptional $55,412 |
| Soviet Union | 100.0 /100 | #57 | Exceptional $55,340 |
| Guyanese | 99.9 /100 | #58 | Exceptional $55,210 |
| Native Hawaiians | 99.9 /100 | #59 | Exceptional $55,158 |
| Immigrants | Lithuania | 99.9 /100 | #60 | Exceptional $55,028 |
| Immigrants | Europe | 99.9 /100 | #61 | Exceptional $55,022 |
| Immigrants | Uzbekistan | 99.8 /100 | #62 | Exceptional $54,846 |
| Immigrants | Belgium | 99.8 /100 | #63 | Exceptional $54,830 |
| Burmese | 99.8 /100 | #64 | Exceptional $54,800 |