Spanish American vs Native/Alaskan Median Female Earnings
COMPARE
Spanish American
Native/Alaskan
Median Female Earnings
Median Female Earnings Comparison
Spanish Americans
Natives/Alaskans
$36,391
MEDIAN FEMALE EARNINGS
0.1/ 100
METRIC RATING
281st/ 347
METRIC RANK
$33,806
MEDIAN FEMALE EARNINGS
0.0/ 100
METRIC RATING
331st/ 347
METRIC RANK
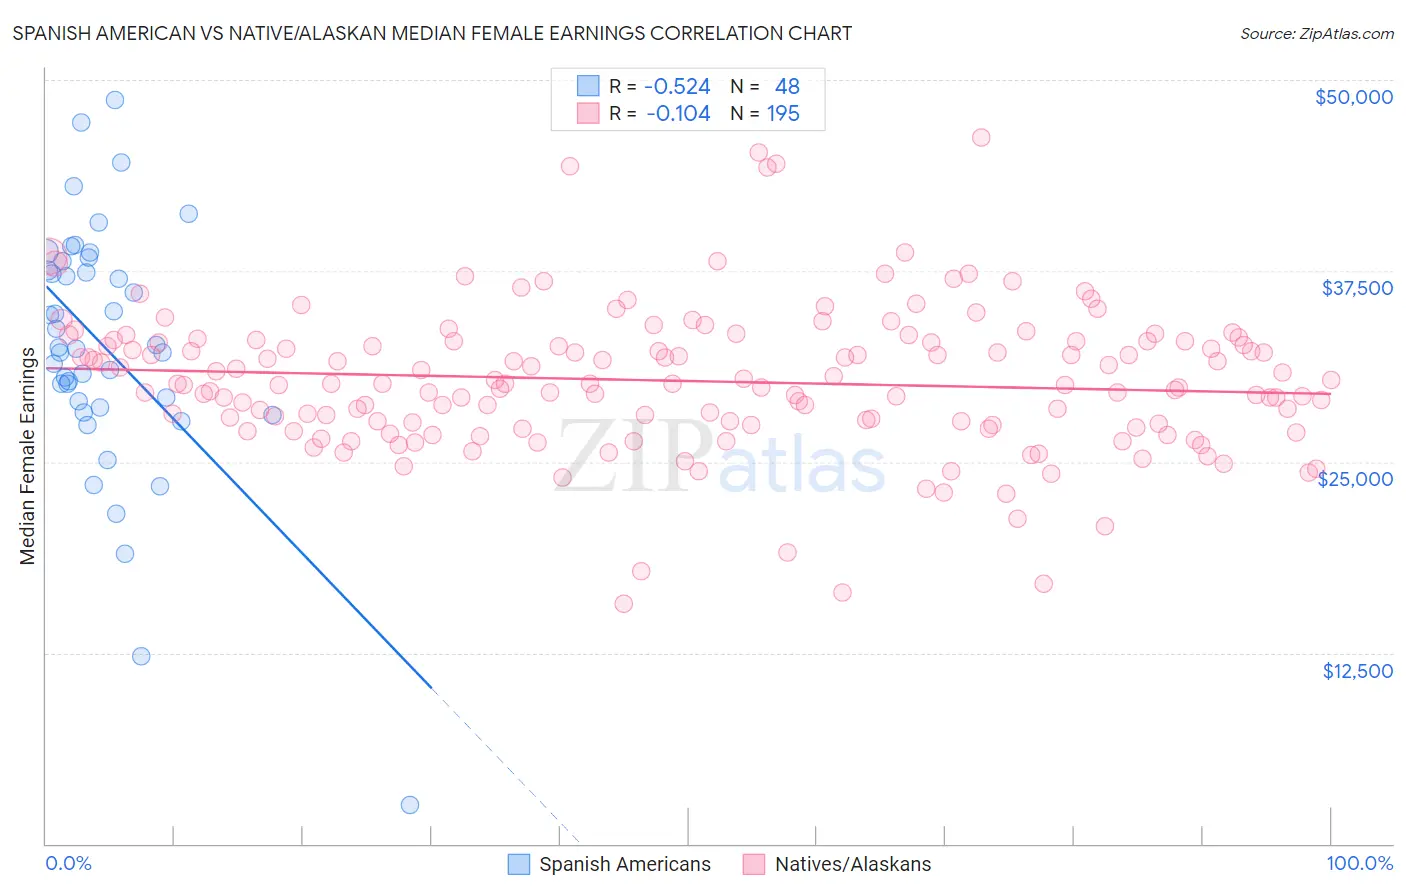
Spanish American vs Native/Alaskan Median Female Earnings Correlation Chart
The statistical analysis conducted on geographies consisting of 103,144,133 people shows a substantial negative correlation between the proportion of Spanish Americans and median female earnings in the United States with a correlation coefficient (R) of -0.524 and weighted average of $36,391. Similarly, the statistical analysis conducted on geographies consisting of 512,112,793 people shows a poor negative correlation between the proportion of Natives/Alaskans and median female earnings in the United States with a correlation coefficient (R) of -0.104 and weighted average of $33,806, a difference of 7.6%.
Median Female Earnings Correlation Summary
| Measurement | Spanish American | Native/Alaskan |
| Minimum | $2,499 | $15,696 |
| Maximum | $48,712 | $46,195 |
| Range | $46,213 | $30,499 |
| Mean | $32,492 | $30,297 |
| Median | $32,451 | $30,121 |
| Interquartile 25% (IQ1) | $28,756 | $27,399 |
| Interquartile 75% (IQ3) | $37,829 | $32,868 |
| Interquartile Range (IQR) | $9,073 | $5,469 |
| Standard Deviation (Sample) | $8,307 | $4,739 |
| Standard Deviation (Population) | $8,220 | $4,727 |
Similar Demographics by Median Female Earnings
Demographics Similar to Spanish Americans by Median Female Earnings
In terms of median female earnings, the demographic groups most similar to Spanish Americans are Iroquois ($36,408, a difference of 0.050%), Haitian ($36,374, a difference of 0.050%), Immigrants from Caribbean ($36,414, a difference of 0.060%), U.S. Virgin Islander ($36,424, a difference of 0.090%), and Marshallese ($36,459, a difference of 0.19%).
| Demographics | Rating | Rank | Median Female Earnings |
| Immigrants | El Salvador | 0.2 /100 | #274 | Tragic $36,673 |
| Africans | 0.1 /100 | #275 | Tragic $36,530 |
| Central Americans | 0.1 /100 | #276 | Tragic $36,492 |
| Marshallese | 0.1 /100 | #277 | Tragic $36,459 |
| U.S. Virgin Islanders | 0.1 /100 | #278 | Tragic $36,424 |
| Immigrants | Caribbean | 0.1 /100 | #279 | Tragic $36,414 |
| Iroquois | 0.1 /100 | #280 | Tragic $36,408 |
| Spanish Americans | 0.1 /100 | #281 | Tragic $36,391 |
| Haitians | 0.1 /100 | #282 | Tragic $36,374 |
| Immigrants | Haiti | 0.1 /100 | #283 | Tragic $36,203 |
| Indonesians | 0.1 /100 | #284 | Tragic $36,140 |
| Paiute | 0.1 /100 | #285 | Tragic $36,056 |
| Osage | 0.0 /100 | #286 | Tragic $36,034 |
| Immigrants | Nicaragua | 0.0 /100 | #287 | Tragic $36,023 |
| Immigrants | Zaire | 0.0 /100 | #288 | Tragic $36,017 |
Demographics Similar to Natives/Alaskans by Median Female Earnings
In terms of median female earnings, the demographic groups most similar to Natives/Alaskans are Choctaw ($33,775, a difference of 0.090%), Menominee ($33,894, a difference of 0.26%), Hopi ($33,932, a difference of 0.37%), Mexican ($33,664, a difference of 0.42%), and Immigrants from Central America ($33,953, a difference of 0.43%).
| Demographics | Rating | Rank | Median Female Earnings |
| Immigrants | Congo | 0.0 /100 | #324 | Tragic $34,317 |
| Dutch West Indians | 0.0 /100 | #325 | Tragic $34,106 |
| Kiowa | 0.0 /100 | #326 | Tragic $34,074 |
| Cajuns | 0.0 /100 | #327 | Tragic $34,034 |
| Immigrants | Central America | 0.0 /100 | #328 | Tragic $33,953 |
| Hopi | 0.0 /100 | #329 | Tragic $33,932 |
| Menominee | 0.0 /100 | #330 | Tragic $33,894 |
| Natives/Alaskans | 0.0 /100 | #331 | Tragic $33,806 |
| Choctaw | 0.0 /100 | #332 | Tragic $33,775 |
| Mexicans | 0.0 /100 | #333 | Tragic $33,664 |
| Spanish American Indians | 0.0 /100 | #334 | Tragic $33,625 |
| Creek | 0.0 /100 | #335 | Tragic $33,437 |
| Ottawa | 0.0 /100 | #336 | Tragic $33,378 |
| Yakama | 0.0 /100 | #337 | Tragic $33,354 |
| Immigrants | Cuba | 0.0 /100 | #338 | Tragic $33,291 |