German Russian vs Immigrants from South Central Asia Householder Income Ages 25 - 44 years
COMPARE
German Russian
Immigrants from South Central Asia
Householder Income Ages 25 - 44 years
Householder Income Ages 25 - 44 years Comparison
German Russians
Immigrants from South Central Asia
$85,220
HOUSEHOLDER INCOME AGES 25 - 44 YEARS
0.6/ 100
METRIC RATING
255th/ 347
METRIC RANK
$116,626
HOUSEHOLDER INCOME AGES 25 - 44 YEARS
100.0/ 100
METRIC RATING
15th/ 347
METRIC RANK
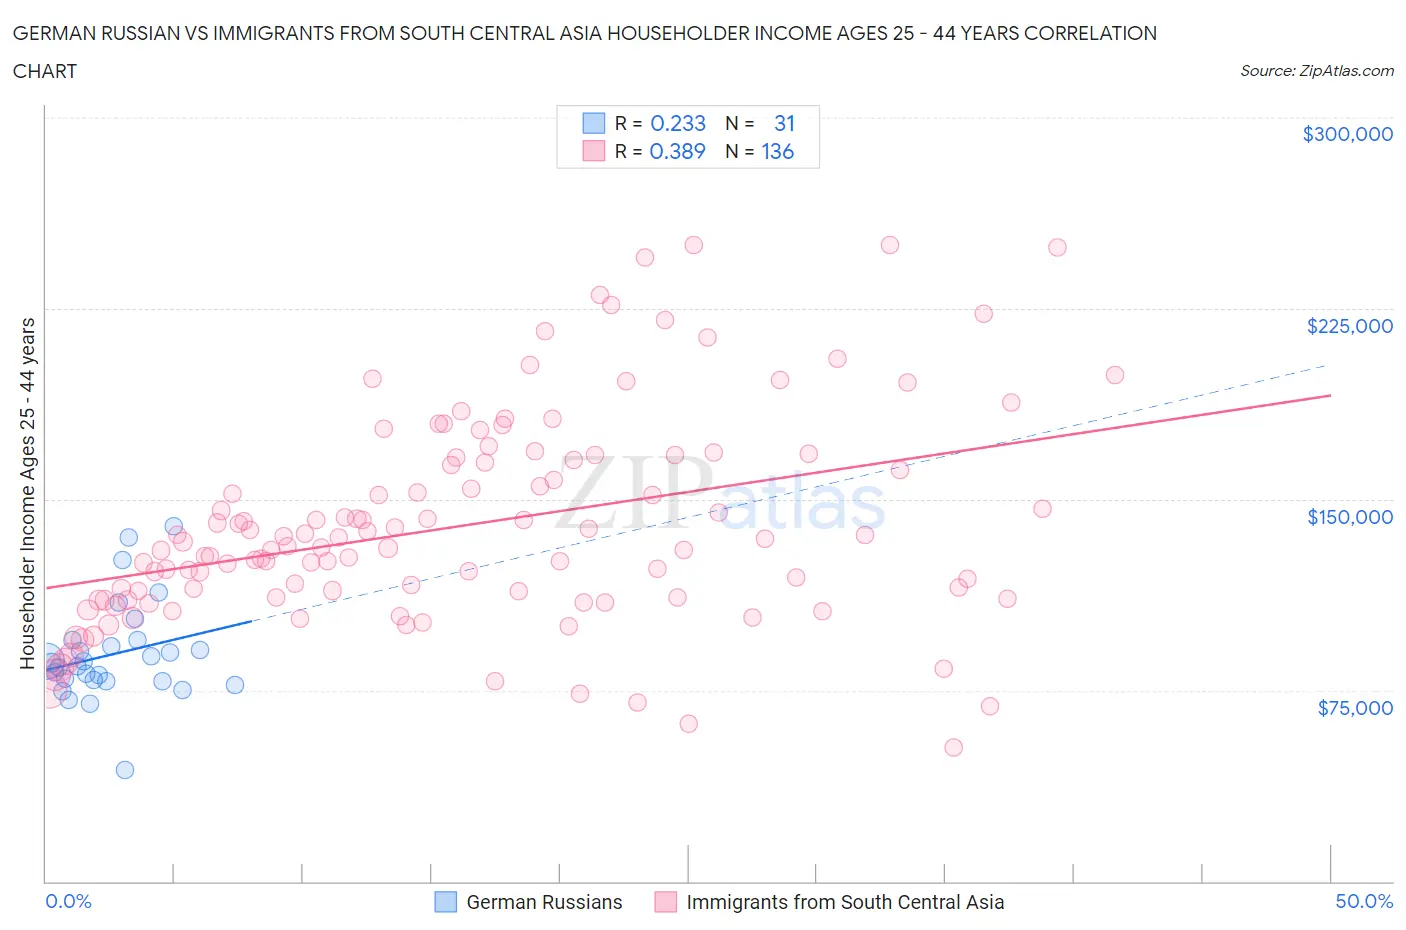
German Russian vs Immigrants from South Central Asia Householder Income Ages 25 - 44 years Correlation Chart
The statistical analysis conducted on geographies consisting of 96,370,550 people shows a weak positive correlation between the proportion of German Russians and household income with householder between the ages 25 and 44 in the United States with a correlation coefficient (R) of 0.233 and weighted average of $85,220. Similarly, the statistical analysis conducted on geographies consisting of 471,423,947 people shows a mild positive correlation between the proportion of Immigrants from South Central Asia and household income with householder between the ages 25 and 44 in the United States with a correlation coefficient (R) of 0.389 and weighted average of $116,626, a difference of 36.8%.
Householder Income Ages 25 - 44 years Correlation Summary
| Measurement | German Russian | Immigrants from South Central Asia |
| Minimum | $43,750 | $52,604 |
| Maximum | $139,479 | $250,001 |
| Range | $95,729 | $197,397 |
| Mean | $89,217 | $139,407 |
| Median | $85,878 | $131,527 |
| Interquartile 25% (IQ1) | $78,393 | $111,176 |
| Interquartile 75% (IQ3) | $94,895 | $164,920 |
| Interquartile Range (IQR) | $16,502 | $53,743 |
| Standard Deviation (Sample) | $19,398 | $41,092 |
| Standard Deviation (Population) | $19,082 | $40,940 |
Similar Demographics by Householder Income Ages 25 - 44 years
Demographics Similar to German Russians by Householder Income Ages 25 - 44 years
In terms of householder income ages 25 - 44 years, the demographic groups most similar to German Russians are Central American ($85,144, a difference of 0.090%), Mexican American Indian ($85,066, a difference of 0.18%), Immigrants from Nicaragua ($84,914, a difference of 0.36%), Immigrants from Laos ($85,553, a difference of 0.39%), and British West Indian ($85,565, a difference of 0.40%).
| Demographics | Rating | Rank | Householder Income Ages 25 - 44 years |
| Immigrants | Sudan | 0.9 /100 | #248 | Tragic $86,109 |
| French American Indians | 0.8 /100 | #249 | Tragic $85,899 |
| Pennsylvania Germans | 0.8 /100 | #250 | Tragic $85,836 |
| Cape Verdeans | 0.8 /100 | #251 | Tragic $85,758 |
| Immigrants | Western Africa | 0.7 /100 | #252 | Tragic $85,676 |
| British West Indians | 0.7 /100 | #253 | Tragic $85,565 |
| Immigrants | Laos | 0.7 /100 | #254 | Tragic $85,553 |
| German Russians | 0.6 /100 | #255 | Tragic $85,220 |
| Central Americans | 0.5 /100 | #256 | Tragic $85,144 |
| Mexican American Indians | 0.5 /100 | #257 | Tragic $85,066 |
| Immigrants | Nicaragua | 0.5 /100 | #258 | Tragic $84,914 |
| Immigrants | Senegal | 0.5 /100 | #259 | Tragic $84,848 |
| Americans | 0.4 /100 | #260 | Tragic $84,791 |
| Inupiat | 0.4 /100 | #261 | Tragic $84,619 |
| Cree | 0.4 /100 | #262 | Tragic $84,574 |
Demographics Similar to Immigrants from South Central Asia by Householder Income Ages 25 - 44 years
In terms of householder income ages 25 - 44 years, the demographic groups most similar to Immigrants from South Central Asia are Cypriot ($116,364, a difference of 0.23%), Immigrants from Israel ($117,219, a difference of 0.51%), Immigrants from Australia ($115,947, a difference of 0.59%), Immigrants from Eastern Asia ($118,056, a difference of 1.2%), and Eastern European ($114,523, a difference of 1.8%).
| Demographics | Rating | Rank | Householder Income Ages 25 - 44 years |
| Iranians | 100.0 /100 | #8 | Exceptional $120,292 |
| Immigrants | China | 100.0 /100 | #9 | Exceptional $119,756 |
| Indians (Asian) | 100.0 /100 | #10 | Exceptional $119,496 |
| Okinawans | 100.0 /100 | #11 | Exceptional $119,349 |
| Immigrants | Iran | 100.0 /100 | #12 | Exceptional $119,204 |
| Immigrants | Eastern Asia | 100.0 /100 | #13 | Exceptional $118,056 |
| Immigrants | Israel | 100.0 /100 | #14 | Exceptional $117,219 |
| Immigrants | South Central Asia | 100.0 /100 | #15 | Exceptional $116,626 |
| Cypriots | 100.0 /100 | #16 | Exceptional $116,364 |
| Immigrants | Australia | 100.0 /100 | #17 | Exceptional $115,947 |
| Eastern Europeans | 100.0 /100 | #18 | Exceptional $114,523 |
| Burmese | 100.0 /100 | #19 | Exceptional $113,701 |
| Immigrants | Korea | 100.0 /100 | #20 | Exceptional $113,401 |
| Asians | 100.0 /100 | #21 | Exceptional $112,666 |
| Immigrants | Belgium | 100.0 /100 | #22 | Exceptional $112,575 |