Immigrants from Uruguay vs Immigrants from Micronesia Householder Income Ages 25 - 44 years
COMPARE
Immigrants from Uruguay
Immigrants from Micronesia
Householder Income Ages 25 - 44 years
Householder Income Ages 25 - 44 years Comparison
Immigrants from Uruguay
Immigrants from Micronesia
$91,171
HOUSEHOLDER INCOME AGES 25 - 44 YEARS
13.2/ 100
METRIC RATING
209th/ 347
METRIC RANK
$80,544
HOUSEHOLDER INCOME AGES 25 - 44 YEARS
0.0/ 100
METRIC RATING
301st/ 347
METRIC RANK
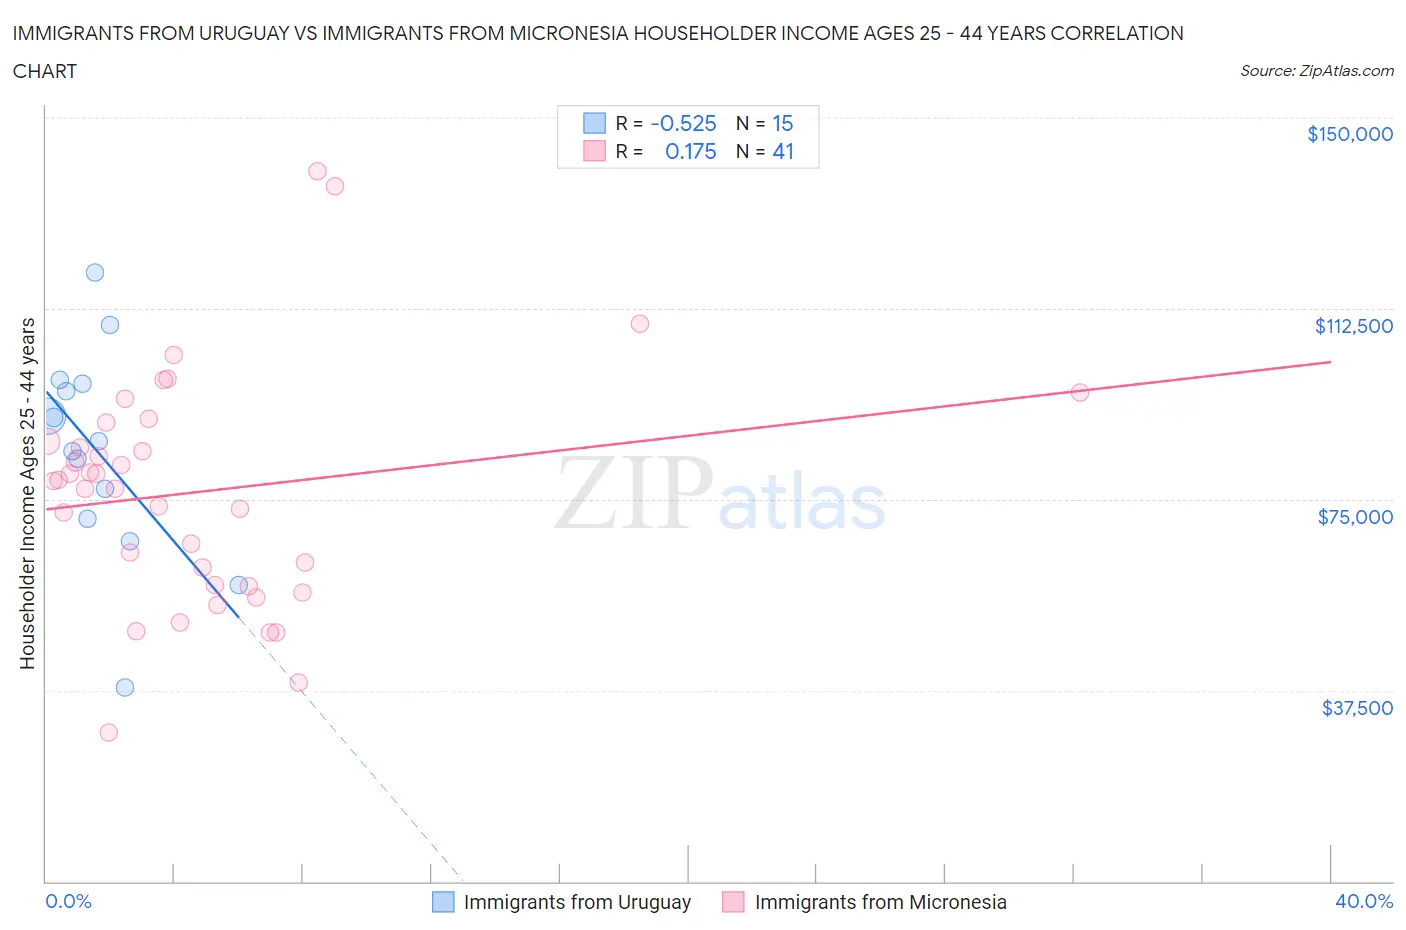
Immigrants from Uruguay vs Immigrants from Micronesia Householder Income Ages 25 - 44 years Correlation Chart
The statistical analysis conducted on geographies consisting of 133,181,410 people shows a substantial negative correlation between the proportion of Immigrants from Uruguay and household income with householder between the ages 25 and 44 in the United States with a correlation coefficient (R) of -0.525 and weighted average of $91,171. Similarly, the statistical analysis conducted on geographies consisting of 61,580,291 people shows a poor positive correlation between the proportion of Immigrants from Micronesia and household income with householder between the ages 25 and 44 in the United States with a correlation coefficient (R) of 0.175 and weighted average of $80,544, a difference of 13.2%.
Householder Income Ages 25 - 44 years Correlation Summary
| Measurement | Immigrants from Uruguay | Immigrants from Micronesia |
| Minimum | $38,006 | $29,188 |
| Maximum | $119,559 | $139,375 |
| Range | $81,553 | $110,187 |
| Mean | $84,577 | $76,482 |
| Median | $86,424 | $78,666 |
| Interquartile 25% (IQ1) | $71,202 | $58,006 |
| Interquartile 75% (IQ3) | $97,689 | $88,259 |
| Interquartile Range (IQR) | $26,487 | $30,252 |
| Standard Deviation (Sample) | $20,417 | $22,989 |
| Standard Deviation (Population) | $19,725 | $22,707 |
Similar Demographics by Householder Income Ages 25 - 44 years
Demographics Similar to Immigrants from Uruguay by Householder Income Ages 25 - 44 years
In terms of householder income ages 25 - 44 years, the demographic groups most similar to Immigrants from Uruguay are Immigrants from Thailand ($91,337, a difference of 0.18%), Aleut ($91,370, a difference of 0.22%), Yugoslavian ($91,368, a difference of 0.22%), Immigrants from Eastern Africa ($91,458, a difference of 0.32%), and Nepalese ($91,498, a difference of 0.36%).
| Demographics | Rating | Rank | Householder Income Ages 25 - 44 years |
| Ecuadorians | 16.0 /100 | #202 | Poor $91,574 |
| Immigrants | Cambodia | 15.7 /100 | #203 | Poor $91,533 |
| Nepalese | 15.4 /100 | #204 | Poor $91,498 |
| Immigrants | Eastern Africa | 15.2 /100 | #205 | Poor $91,458 |
| Aleuts | 14.5 /100 | #206 | Poor $91,370 |
| Yugoslavians | 14.5 /100 | #207 | Poor $91,368 |
| Immigrants | Thailand | 14.3 /100 | #208 | Poor $91,337 |
| Immigrants | Uruguay | 13.2 /100 | #209 | Poor $91,171 |
| Immigrants | Kenya | 10.9 /100 | #210 | Poor $90,767 |
| Iraqis | 10.8 /100 | #211 | Poor $90,764 |
| Hawaiians | 10.6 /100 | #212 | Poor $90,722 |
| Immigrants | Bangladesh | 9.3 /100 | #213 | Tragic $90,448 |
| Immigrants | Africa | 8.9 /100 | #214 | Tragic $90,372 |
| Panamanians | 8.1 /100 | #215 | Tragic $90,193 |
| Ghanaians | 7.9 /100 | #216 | Tragic $90,137 |
Demographics Similar to Immigrants from Micronesia by Householder Income Ages 25 - 44 years
In terms of householder income ages 25 - 44 years, the demographic groups most similar to Immigrants from Micronesia are Hispanic or Latino ($80,515, a difference of 0.040%), Mexican ($80,427, a difference of 0.14%), Immigrants from Caribbean ($80,326, a difference of 0.27%), Immigrants from Dominican Republic ($80,319, a difference of 0.28%), and Apache ($80,260, a difference of 0.35%).
| Demographics | Rating | Rank | Householder Income Ages 25 - 44 years |
| Cubans | 0.1 /100 | #294 | Tragic $81,483 |
| Bangladeshis | 0.1 /100 | #295 | Tragic $81,363 |
| Immigrants | Dominica | 0.1 /100 | #296 | Tragic $81,351 |
| Immigrants | Guatemala | 0.1 /100 | #297 | Tragic $81,341 |
| Dominicans | 0.1 /100 | #298 | Tragic $81,229 |
| Immigrants | Liberia | 0.1 /100 | #299 | Tragic $80,863 |
| Cherokee | 0.0 /100 | #300 | Tragic $80,843 |
| Immigrants | Micronesia | 0.0 /100 | #301 | Tragic $80,544 |
| Hispanics or Latinos | 0.0 /100 | #302 | Tragic $80,515 |
| Mexicans | 0.0 /100 | #303 | Tragic $80,427 |
| Immigrants | Caribbean | 0.0 /100 | #304 | Tragic $80,326 |
| Immigrants | Dominican Republic | 0.0 /100 | #305 | Tragic $80,319 |
| Apache | 0.0 /100 | #306 | Tragic $80,260 |
| Haitians | 0.0 /100 | #307 | Tragic $80,055 |
| Immigrants | Central America | 0.0 /100 | #308 | Tragic $80,012 |