South American Indian vs Czech Householder Income Over 65 years
COMPARE
South American Indian
Czech
Householder Income Over 65 years
Householder Income Over 65 years Comparison
South American Indians
Czechs
$62,215
HOUSEHOLDER INCOME OVER 65 YEARS
78.7/ 100
METRIC RATING
142nd/ 347
METRIC RANK
$61,244
HOUSEHOLDER INCOME OVER 65 YEARS
57.2/ 100
METRIC RATING
162nd/ 347
METRIC RANK
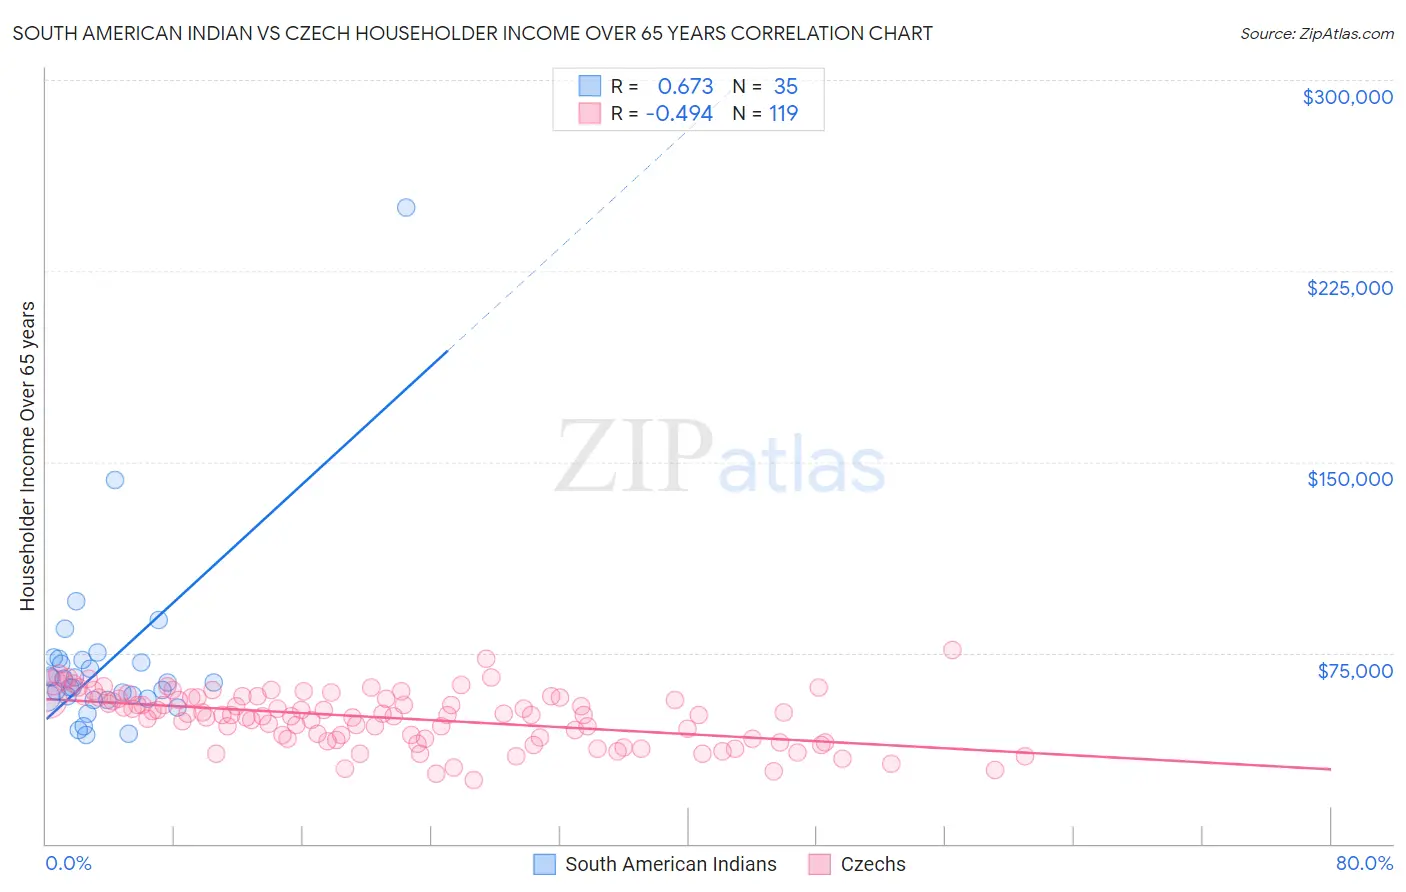
South American Indian vs Czech Householder Income Over 65 years Correlation Chart
The statistical analysis conducted on geographies consisting of 164,391,818 people shows a significant positive correlation between the proportion of South American Indians and household income with householder over the age of 65 in the United States with a correlation coefficient (R) of 0.673 and weighted average of $62,215. Similarly, the statistical analysis conducted on geographies consisting of 482,438,211 people shows a moderate negative correlation between the proportion of Czechs and household income with householder over the age of 65 in the United States with a correlation coefficient (R) of -0.494 and weighted average of $61,244, a difference of 1.6%.
Householder Income Over 65 years Correlation Summary
| Measurement | South American Indian | Czech |
| Minimum | $42,500 | $24,894 |
| Maximum | $250,001 | $76,250 |
| Range | $207,501 | $51,356 |
| Mean | $70,859 | $49,506 |
| Median | $63,281 | $50,665 |
| Interquartile 25% (IQ1) | $56,818 | $41,396 |
| Interquartile 75% (IQ3) | $72,159 | $57,446 |
| Interquartile Range (IQR) | $15,341 | $16,049 |
| Standard Deviation (Sample) | $35,900 | $10,394 |
| Standard Deviation (Population) | $35,384 | $10,351 |
Demographics Similar to South American Indians and Czechs by Householder Income Over 65 years
In terms of householder income over 65 years, the demographic groups most similar to South American Indians are Immigrants from Belarus ($62,162, a difference of 0.090%), Immigrants from Peru ($61,988, a difference of 0.37%), Immigrants from Uganda ($61,976, a difference of 0.39%), Immigrants from Southern Europe ($61,902, a difference of 0.51%), and Immigrants from Nepal ($61,843, a difference of 0.60%). Similarly, the demographic groups most similar to Czechs are Icelander ($61,270, a difference of 0.040%), Portuguese ($61,440, a difference of 0.32%), Brazilian ($61,465, a difference of 0.36%), English ($61,487, a difference of 0.40%), and Macedonian ($61,564, a difference of 0.52%).
| Demographics | Rating | Rank | Householder Income Over 65 years |
| South American Indians | 78.7 /100 | #142 | Good $62,215 |
| Immigrants | Belarus | 77.8 /100 | #143 | Good $62,162 |
| Immigrants | Peru | 74.4 /100 | #144 | Good $61,988 |
| Immigrants | Uganda | 74.2 /100 | #145 | Good $61,976 |
| Immigrants | Southern Europe | 72.7 /100 | #146 | Good $61,902 |
| Immigrants | Nepal | 71.4 /100 | #147 | Good $61,843 |
| Alsatians | 70.5 /100 | #148 | Good $61,797 |
| Scottish | 69.1 /100 | #149 | Good $61,735 |
| Slavs | 68.5 /100 | #150 | Good $61,709 |
| Hungarians | 67.7 /100 | #151 | Good $61,673 |
| Armenians | 67.3 /100 | #152 | Good $61,656 |
| Costa Ricans | 66.9 /100 | #153 | Good $61,638 |
| Swiss | 66.5 /100 | #154 | Good $61,621 |
| Poles | 65.9 /100 | #155 | Good $61,598 |
| Scandinavians | 65.6 /100 | #156 | Good $61,586 |
| Macedonians | 65.1 /100 | #157 | Good $61,564 |
| English | 63.3 /100 | #158 | Good $61,487 |
| Brazilians | 62.7 /100 | #159 | Good $61,465 |
| Portuguese | 62.1 /100 | #160 | Good $61,440 |
| Icelanders | 57.9 /100 | #161 | Average $61,270 |
| Czechs | 57.2 /100 | #162 | Average $61,244 |