Slovak vs Liberian Associate's Degree
COMPARE
Slovak
Liberian
Associate's Degree
Associate's Degree Comparison
Slovaks
Liberians
46.3%
ASSOCIATE'S DEGREE
48.4/ 100
METRIC RATING
177th/ 347
METRIC RANK
43.3%
ASSOCIATE'S DEGREE
2.9/ 100
METRIC RATING
231st/ 347
METRIC RANK
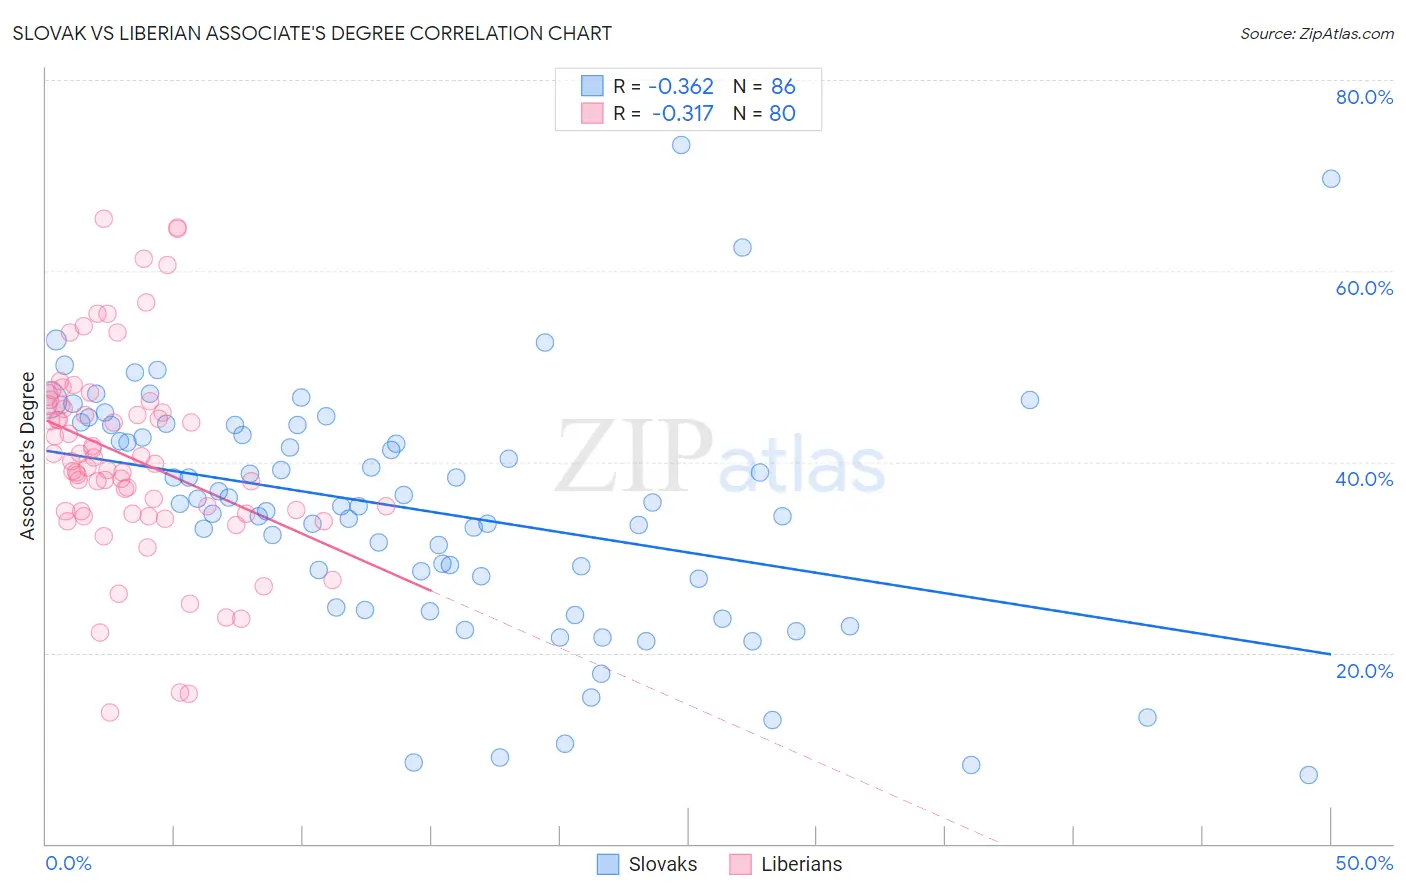
Slovak vs Liberian Associate's Degree Correlation Chart
The statistical analysis conducted on geographies consisting of 397,875,693 people shows a mild negative correlation between the proportion of Slovaks and percentage of population with at least associate's degree education in the United States with a correlation coefficient (R) of -0.362 and weighted average of 46.3%. Similarly, the statistical analysis conducted on geographies consisting of 118,102,624 people shows a mild negative correlation between the proportion of Liberians and percentage of population with at least associate's degree education in the United States with a correlation coefficient (R) of -0.317 and weighted average of 43.3%, a difference of 6.9%.
Associate's Degree Correlation Summary
| Measurement | Slovak | Liberian |
| Minimum | 7.1% | 13.8% |
| Maximum | 73.2% | 65.5% |
| Range | 66.0% | 51.7% |
| Mean | 34.9% | 40.5% |
| Median | 35.4% | 39.9% |
| Interquartile 25% (IQ1) | 27.8% | 34.7% |
| Interquartile 75% (IQ3) | 43.8% | 45.9% |
| Interquartile Range (IQR) | 16.1% | 11.3% |
| Standard Deviation (Sample) | 12.8% | 10.6% |
| Standard Deviation (Population) | 12.7% | 10.5% |
Similar Demographics by Associate's Degree
Demographics Similar to Slovaks by Associate's Degree
In terms of associate's degree, the demographic groups most similar to Slovaks are Finnish (46.3%, a difference of 0.010%), Immigrants from Bosnia and Herzegovina (46.3%, a difference of 0.010%), Belgian (46.3%, a difference of 0.040%), Sri Lankan (46.3%, a difference of 0.060%), and English (46.4%, a difference of 0.12%).
| Demographics | Rating | Rank | Associate's Degree |
| Irish | 53.6 /100 | #170 | Average 46.5% |
| Basques | 52.8 /100 | #171 | Average 46.5% |
| Peruvians | 50.5 /100 | #172 | Average 46.4% |
| Immigrants | Iraq | 50.3 /100 | #173 | Average 46.4% |
| English | 50.0 /100 | #174 | Average 46.4% |
| Belgians | 48.9 /100 | #175 | Average 46.3% |
| Finns | 48.5 /100 | #176 | Average 46.3% |
| Slovaks | 48.4 /100 | #177 | Average 46.3% |
| Immigrants | Bosnia and Herzegovina | 48.3 /100 | #178 | Average 46.3% |
| Sri Lankans | 47.6 /100 | #179 | Average 46.3% |
| Bermudans | 46.4 /100 | #180 | Average 46.2% |
| Immigrants | Colombia | 41.3 /100 | #181 | Average 46.0% |
| Swiss | 40.4 /100 | #182 | Average 46.0% |
| Yugoslavians | 40.2 /100 | #183 | Average 46.0% |
| Czechoslovakians | 40.0 /100 | #184 | Average 46.0% |
Demographics Similar to Liberians by Associate's Degree
In terms of associate's degree, the demographic groups most similar to Liberians are Immigrants from Barbados (43.3%, a difference of 0.010%), Immigrants from Trinidad and Tobago (43.3%, a difference of 0.080%), Hmong (43.4%, a difference of 0.23%), Native Hawaiian (43.1%, a difference of 0.43%), and Tongan (43.0%, a difference of 0.59%).
| Demographics | Rating | Rank | Associate's Degree |
| West Indians | 5.2 /100 | #224 | Tragic 43.8% |
| Guamanians/Chamorros | 4.8 /100 | #225 | Tragic 43.8% |
| Immigrants | Burma/Myanmar | 4.3 /100 | #226 | Tragic 43.7% |
| Trinidadians and Tobagonians | 4.0 /100 | #227 | Tragic 43.6% |
| Hmong | 3.2 /100 | #228 | Tragic 43.4% |
| Immigrants | Trinidad and Tobago | 3.0 /100 | #229 | Tragic 43.3% |
| Immigrants | Barbados | 2.9 /100 | #230 | Tragic 43.3% |
| Liberians | 2.9 /100 | #231 | Tragic 43.3% |
| Native Hawaiians | 2.3 /100 | #232 | Tragic 43.1% |
| Tongans | 2.2 /100 | #233 | Tragic 43.0% |
| Tlingit-Haida | 2.1 /100 | #234 | Tragic 43.0% |
| Ecuadorians | 2.0 /100 | #235 | Tragic 43.0% |
| Immigrants | St. Vincent and the Grenadines | 1.9 /100 | #236 | Tragic 42.9% |
| Immigrants | Nonimmigrants | 1.9 /100 | #237 | Tragic 42.9% |
| Iroquois | 1.7 /100 | #238 | Tragic 42.8% |