Scandinavian vs Portuguese Householder Income Over 65 years
COMPARE
Scandinavian
Portuguese
Householder Income Over 65 years
Householder Income Over 65 years Comparison
Scandinavians
Portuguese
$61,586
HOUSEHOLDER INCOME OVER 65 YEARS
65.6/ 100
METRIC RATING
156th/ 347
METRIC RANK
$61,440
HOUSEHOLDER INCOME OVER 65 YEARS
62.1/ 100
METRIC RATING
160th/ 347
METRIC RANK
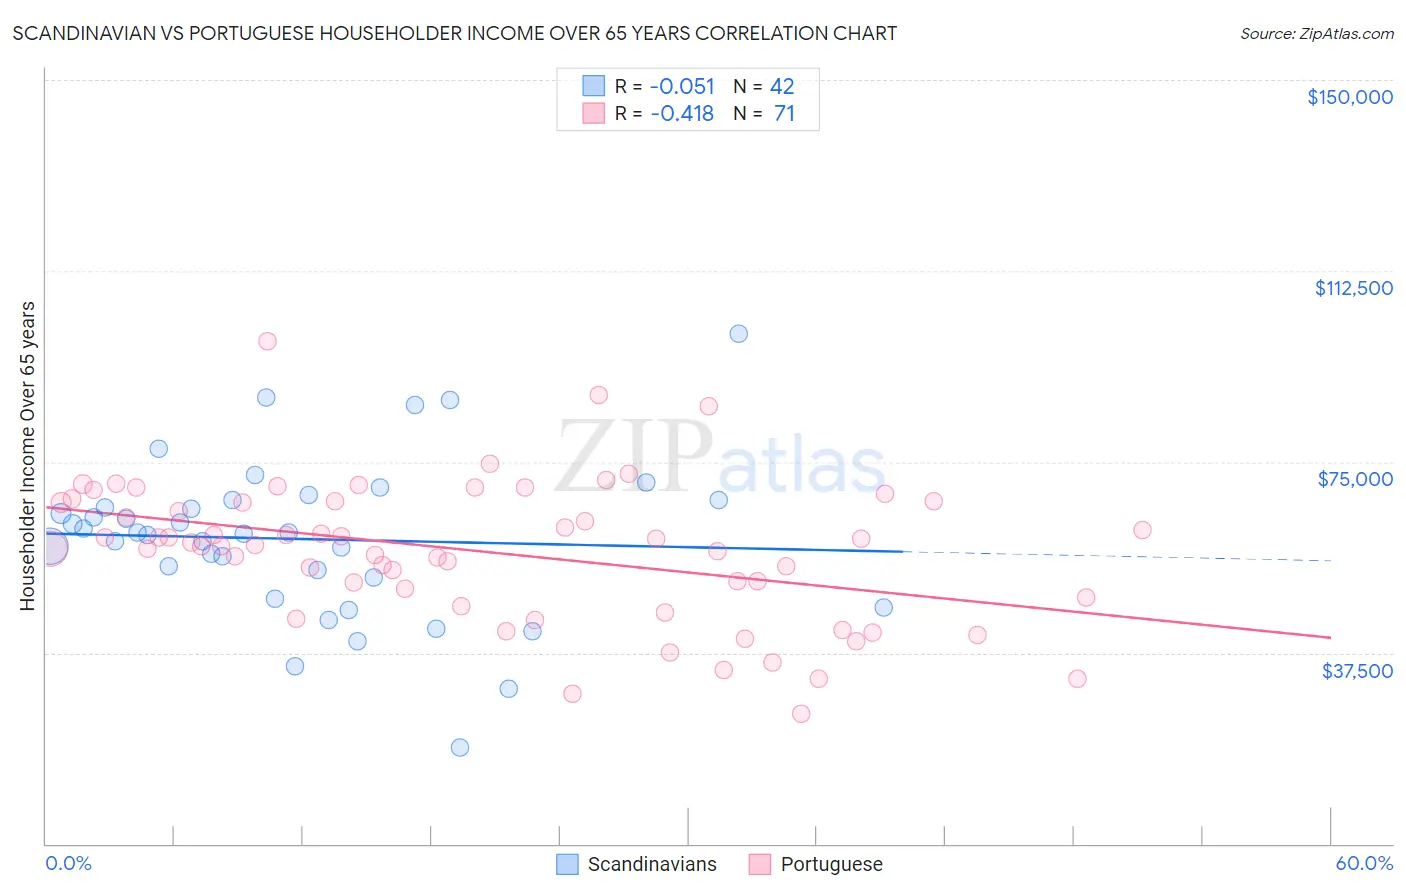
Scandinavian vs Portuguese Householder Income Over 65 years Correlation Chart
The statistical analysis conducted on geographies consisting of 470,228,291 people shows a slight negative correlation between the proportion of Scandinavians and household income with householder over the age of 65 in the United States with a correlation coefficient (R) of -0.051 and weighted average of $61,586. Similarly, the statistical analysis conducted on geographies consisting of 448,159,780 people shows a moderate negative correlation between the proportion of Portuguese and household income with householder over the age of 65 in the United States with a correlation coefficient (R) of -0.418 and weighted average of $61,440, a difference of 0.24%.
Householder Income Over 65 years Correlation Summary
| Measurement | Scandinavian | Portuguese |
| Minimum | $18,992 | $25,525 |
| Maximum | $100,104 | $98,662 |
| Range | $81,112 | $73,137 |
| Mean | $59,842 | $57,386 |
| Median | $60,960 | $58,571 |
| Interquartile 25% (IQ1) | $52,396 | $48,306 |
| Interquartile 75% (IQ3) | $67,455 | $67,302 |
| Interquartile Range (IQR) | $15,058 | $18,996 |
| Standard Deviation (Sample) | $15,633 | $13,814 |
| Standard Deviation (Population) | $15,446 | $13,716 |
Demographics Similar to Scandinavians and Portuguese by Householder Income Over 65 years
In terms of householder income over 65 years, the demographic groups most similar to Scandinavians are Polish ($61,598, a difference of 0.020%), Macedonian ($61,564, a difference of 0.040%), Swiss ($61,621, a difference of 0.060%), Costa Rican ($61,638, a difference of 0.080%), and Armenian ($61,656, a difference of 0.11%). Similarly, the demographic groups most similar to Portuguese are Brazilian ($61,465, a difference of 0.040%), English ($61,487, a difference of 0.080%), Macedonian ($61,564, a difference of 0.20%), Polish ($61,598, a difference of 0.26%), and Icelander ($61,270, a difference of 0.28%).
| Demographics | Rating | Rank | Householder Income Over 65 years |
| Alsatians | 70.5 /100 | #148 | Good $61,797 |
| Scottish | 69.1 /100 | #149 | Good $61,735 |
| Slavs | 68.5 /100 | #150 | Good $61,709 |
| Hungarians | 67.7 /100 | #151 | Good $61,673 |
| Armenians | 67.3 /100 | #152 | Good $61,656 |
| Costa Ricans | 66.9 /100 | #153 | Good $61,638 |
| Swiss | 66.5 /100 | #154 | Good $61,621 |
| Poles | 65.9 /100 | #155 | Good $61,598 |
| Scandinavians | 65.6 /100 | #156 | Good $61,586 |
| Macedonians | 65.1 /100 | #157 | Good $61,564 |
| English | 63.3 /100 | #158 | Good $61,487 |
| Brazilians | 62.7 /100 | #159 | Good $61,465 |
| Portuguese | 62.1 /100 | #160 | Good $61,440 |
| Icelanders | 57.9 /100 | #161 | Average $61,270 |
| Czechs | 57.2 /100 | #162 | Average $61,244 |
| Ugandans | 55.5 /100 | #163 | Average $61,177 |
| Immigrants | North Macedonia | 55.4 /100 | #164 | Average $61,175 |
| Immigrants | Ukraine | 55.1 /100 | #165 | Average $61,163 |
| Immigrants | Eastern Africa | 55.0 /100 | #166 | Average $61,157 |
| Norwegians | 53.6 /100 | #167 | Average $61,104 |
| Irish | 53.4 /100 | #168 | Average $61,097 |