Maltese vs Alaska Native Householder Income Under 25 years
COMPARE
Maltese
Alaska Native
Householder Income Under 25 years
Householder Income Under 25 years Comparison
Maltese
Alaska Natives
$53,735
HOUSEHOLDER INCOME UNDER 25 YEARS
97.8/ 100
METRIC RATING
108th/ 347
METRIC RANK
$54,000
HOUSEHOLDER INCOME UNDER 25 YEARS
98.8/ 100
METRIC RATING
99th/ 347
METRIC RANK
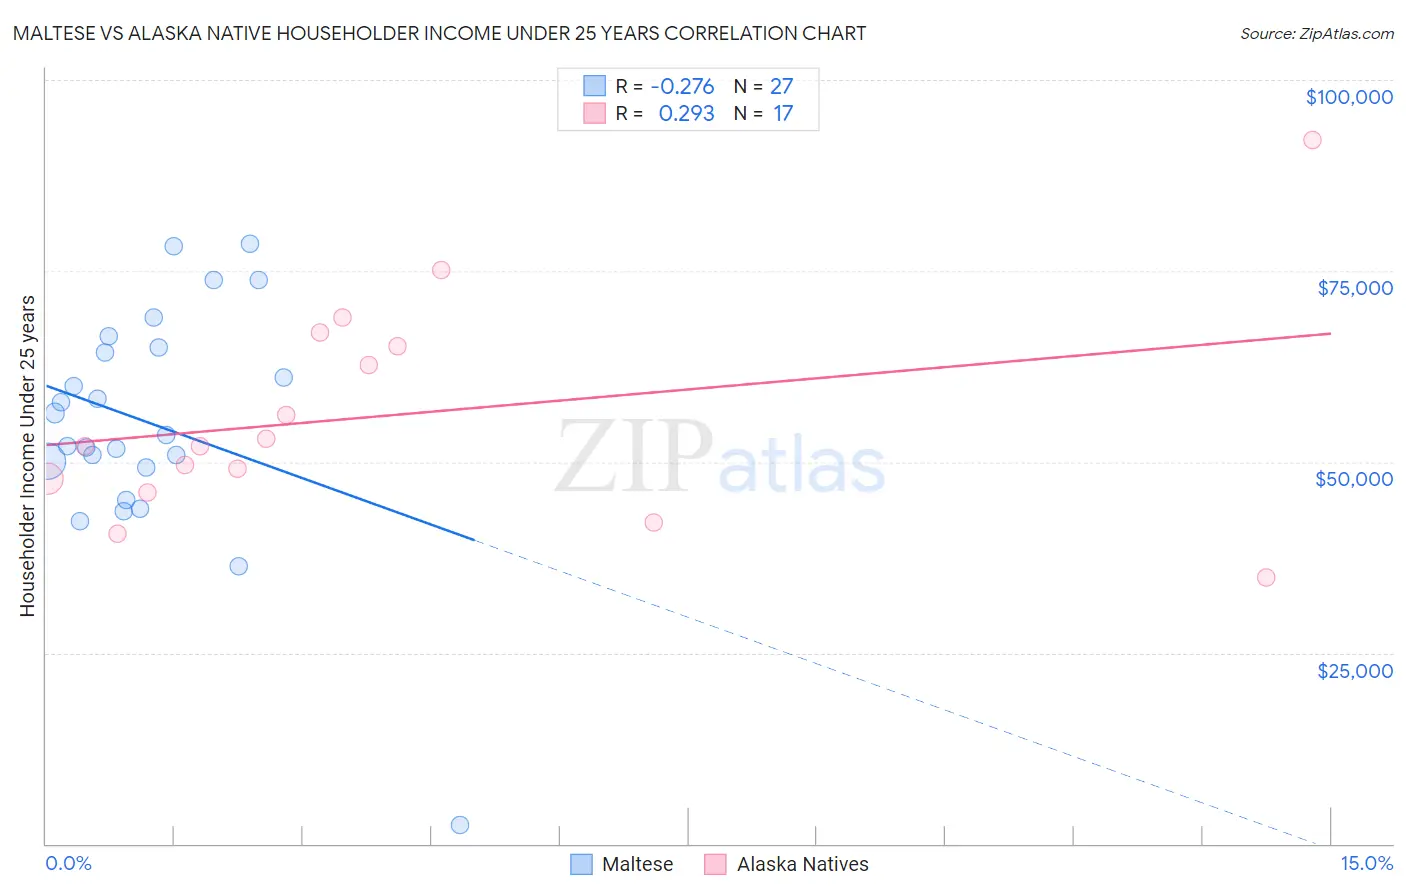
Maltese vs Alaska Native Householder Income Under 25 years Correlation Chart
The statistical analysis conducted on geographies consisting of 112,948,786 people shows a weak negative correlation between the proportion of Maltese and household income with householder under the age of 25 in the United States with a correlation coefficient (R) of -0.276 and weighted average of $53,735. Similarly, the statistical analysis conducted on geographies consisting of 73,501,292 people shows a weak positive correlation between the proportion of Alaska Natives and household income with householder under the age of 25 in the United States with a correlation coefficient (R) of 0.293 and weighted average of $54,000, a difference of 0.49%.
Householder Income Under 25 years Correlation Summary
| Measurement | Maltese | Alaska Native |
| Minimum | $2,499 | $34,792 |
| Maximum | $78,500 | $92,109 |
| Range | $76,001 | $57,317 |
| Mean | $55,048 | $56,134 |
| Median | $53,500 | $52,108 |
| Interquartile 25% (IQ1) | $49,238 | $46,888 |
| Interquartile 75% (IQ3) | $65,046 | $66,052 |
| Interquartile Range (IQR) | $15,807 | $19,164 |
| Standard Deviation (Sample) | $15,373 | $14,277 |
| Standard Deviation (Population) | $15,086 | $13,850 |
Demographics Similar to Maltese and Alaska Natives by Householder Income Under 25 years
In terms of householder income under 25 years, the demographic groups most similar to Maltese are Australian ($53,739, a difference of 0.010%), Immigrants from Ecuador ($53,722, a difference of 0.020%), Greek ($53,715, a difference of 0.040%), Immigrants from Colombia ($53,714, a difference of 0.040%), and Immigrants from Oceania ($53,680, a difference of 0.10%). Similarly, the demographic groups most similar to Alaska Natives are Immigrants from Kazakhstan ($53,990, a difference of 0.020%), South American ($53,939, a difference of 0.11%), Eastern European ($54,066, a difference of 0.12%), Ecuadorian ($53,911, a difference of 0.16%), and Immigrants from Portugal ($54,105, a difference of 0.19%).
| Demographics | Rating | Rank | Householder Income Under 25 years |
| Immigrants | Argentina | 99.3 /100 | #93 | Exceptional $54,209 |
| Immigrants | Sierra Leone | 99.3 /100 | #94 | Exceptional $54,190 |
| Immigrants | Malaysia | 99.2 /100 | #95 | Exceptional $54,179 |
| Argentineans | 99.2 /100 | #96 | Exceptional $54,154 |
| Immigrants | Portugal | 99.1 /100 | #97 | Exceptional $54,105 |
| Eastern Europeans | 99.0 /100 | #98 | Exceptional $54,066 |
| Alaska Natives | 98.8 /100 | #99 | Exceptional $54,000 |
| Immigrants | Kazakhstan | 98.8 /100 | #100 | Exceptional $53,990 |
| South Americans | 98.6 /100 | #101 | Exceptional $53,939 |
| Ecuadorians | 98.5 /100 | #102 | Exceptional $53,911 |
| Ukrainians | 98.3 /100 | #103 | Exceptional $53,843 |
| Ethiopians | 98.2 /100 | #104 | Exceptional $53,818 |
| Immigrants | France | 98.1 /100 | #105 | Exceptional $53,805 |
| Albanians | 98.1 /100 | #106 | Exceptional $53,794 |
| Australians | 97.8 /100 | #107 | Exceptional $53,739 |
| Maltese | 97.8 /100 | #108 | Exceptional $53,735 |
| Immigrants | Ecuador | 97.7 /100 | #109 | Exceptional $53,722 |
| Greeks | 97.7 /100 | #110 | Exceptional $53,715 |
| Immigrants | Colombia | 97.7 /100 | #111 | Exceptional $53,714 |
| Immigrants | Oceania | 97.5 /100 | #112 | Exceptional $53,680 |
| Romanians | 97.2 /100 | #113 | Exceptional $53,632 |