Romanian vs Sierra Leonean Householder Income Under 25 years
COMPARE
Romanian
Sierra Leonean
Householder Income Under 25 years
Householder Income Under 25 years Comparison
Romanians
Sierra Leoneans
$53,632
HOUSEHOLDER INCOME UNDER 25 YEARS
97.2/ 100
METRIC RATING
113th/ 347
METRIC RANK
$57,272
HOUSEHOLDER INCOME UNDER 25 YEARS
100.0/ 100
METRIC RATING
17th/ 347
METRIC RANK
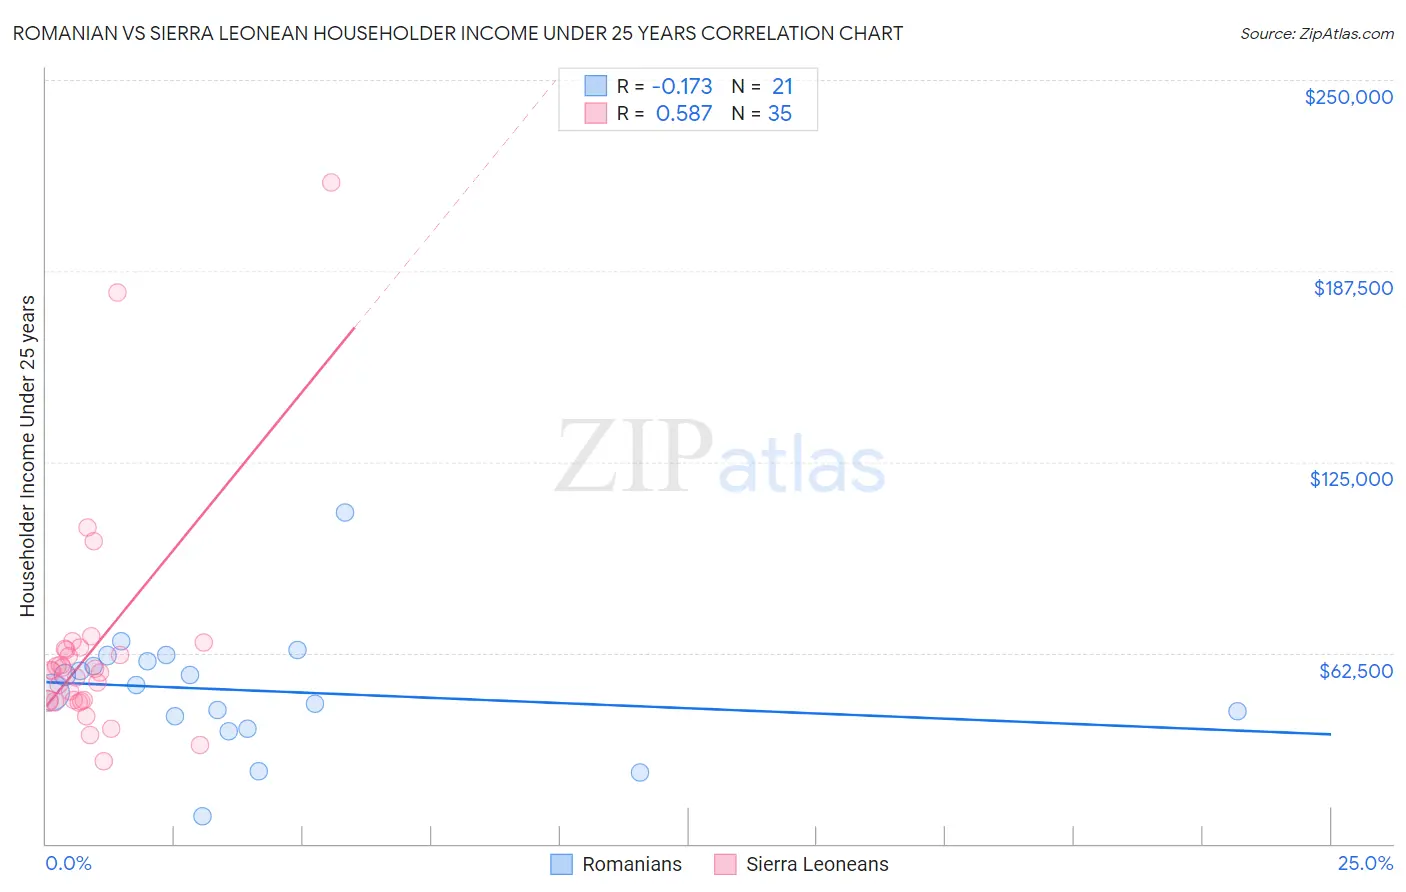
Romanian vs Sierra Leonean Householder Income Under 25 years Correlation Chart
The statistical analysis conducted on geographies consisting of 317,146,706 people shows a poor negative correlation between the proportion of Romanians and household income with householder under the age of 25 in the United States with a correlation coefficient (R) of -0.173 and weighted average of $53,632. Similarly, the statistical analysis conducted on geographies consisting of 78,503,409 people shows a substantial positive correlation between the proportion of Sierra Leoneans and household income with householder under the age of 25 in the United States with a correlation coefficient (R) of 0.587 and weighted average of $57,272, a difference of 6.8%.
Householder Income Under 25 years Correlation Summary
| Measurement | Romanian | Sierra Leonean |
| Minimum | $9,000 | $26,847 |
| Maximum | $108,452 | $216,509 |
| Range | $99,452 | $189,662 |
| Mean | $50,147 | $63,601 |
| Median | $51,890 | $56,595 |
| Interquartile 25% (IQ1) | $39,493 | $46,837 |
| Interquartile 75% (IQ3) | $60,663 | $63,925 |
| Interquartile Range (IQR) | $21,170 | $17,087 |
| Standard Deviation (Sample) | $20,018 | $37,157 |
| Standard Deviation (Population) | $19,536 | $36,623 |
Similar Demographics by Householder Income Under 25 years
Demographics Similar to Romanians by Householder Income Under 25 years
In terms of householder income under 25 years, the demographic groups most similar to Romanians are Immigrants from Sweden ($53,621, a difference of 0.020%), Immigrants from Albania ($53,597, a difference of 0.070%), Immigrants from Oceania ($53,680, a difference of 0.090%), Immigrants from Spain ($53,560, a difference of 0.14%), and Greek ($53,715, a difference of 0.15%).
| Demographics | Rating | Rank | Householder Income Under 25 years |
| Albanians | 98.1 /100 | #106 | Exceptional $53,794 |
| Australians | 97.8 /100 | #107 | Exceptional $53,739 |
| Maltese | 97.8 /100 | #108 | Exceptional $53,735 |
| Immigrants | Ecuador | 97.7 /100 | #109 | Exceptional $53,722 |
| Greeks | 97.7 /100 | #110 | Exceptional $53,715 |
| Immigrants | Colombia | 97.7 /100 | #111 | Exceptional $53,714 |
| Immigrants | Oceania | 97.5 /100 | #112 | Exceptional $53,680 |
| Romanians | 97.2 /100 | #113 | Exceptional $53,632 |
| Immigrants | Sweden | 97.1 /100 | #114 | Exceptional $53,621 |
| Immigrants | Albania | 96.9 /100 | #115 | Exceptional $53,597 |
| Immigrants | Spain | 96.6 /100 | #116 | Exceptional $53,560 |
| Lithuanians | 96.6 /100 | #117 | Exceptional $53,552 |
| Immigrants | Switzerland | 96.3 /100 | #118 | Exceptional $53,528 |
| Italians | 95.4 /100 | #119 | Exceptional $53,426 |
| Guamanians/Chamorros | 95.3 /100 | #120 | Exceptional $53,423 |
Demographics Similar to Sierra Leoneans by Householder Income Under 25 years
In terms of householder income under 25 years, the demographic groups most similar to Sierra Leoneans are Immigrants from Eastern Asia ($57,123, a difference of 0.26%), Bhutanese ($57,078, a difference of 0.34%), Immigrants from Ireland ($57,075, a difference of 0.35%), Immigrants from Fiji ($57,074, a difference of 0.35%), and Immigrants from Afghanistan ($57,478, a difference of 0.36%).
| Demographics | Rating | Rank | Householder Income Under 25 years |
| Afghans | 100.0 /100 | #10 | Exceptional $58,019 |
| Immigrants | China | 100.0 /100 | #11 | Exceptional $57,931 |
| Immigrants | Philippines | 100.0 /100 | #12 | Exceptional $57,930 |
| Immigrants | South Central Asia | 100.0 /100 | #13 | Exceptional $57,818 |
| Filipinos | 100.0 /100 | #14 | Exceptional $57,740 |
| Koreans | 100.0 /100 | #15 | Exceptional $57,730 |
| Immigrants | Afghanistan | 100.0 /100 | #16 | Exceptional $57,478 |
| Sierra Leoneans | 100.0 /100 | #17 | Exceptional $57,272 |
| Immigrants | Eastern Asia | 100.0 /100 | #18 | Exceptional $57,123 |
| Bhutanese | 100.0 /100 | #19 | Exceptional $57,078 |
| Immigrants | Ireland | 100.0 /100 | #20 | Exceptional $57,075 |
| Immigrants | Fiji | 100.0 /100 | #21 | Exceptional $57,074 |
| Asians | 100.0 /100 | #22 | Exceptional $57,003 |
| Tongans | 100.0 /100 | #23 | Exceptional $56,972 |
| Immigrants | Singapore | 100.0 /100 | #24 | Exceptional $56,835 |