Bangladeshi vs Liberian Householder Income Under 25 years
COMPARE
Bangladeshi
Liberian
Householder Income Under 25 years
Householder Income Under 25 years Comparison
Bangladeshis
Liberians
$47,589
HOUSEHOLDER INCOME UNDER 25 YEARS
0.0/ 100
METRIC RATING
307th/ 347
METRIC RANK
$48,917
HOUSEHOLDER INCOME UNDER 25 YEARS
0.0/ 100
METRIC RATING
288th/ 347
METRIC RANK
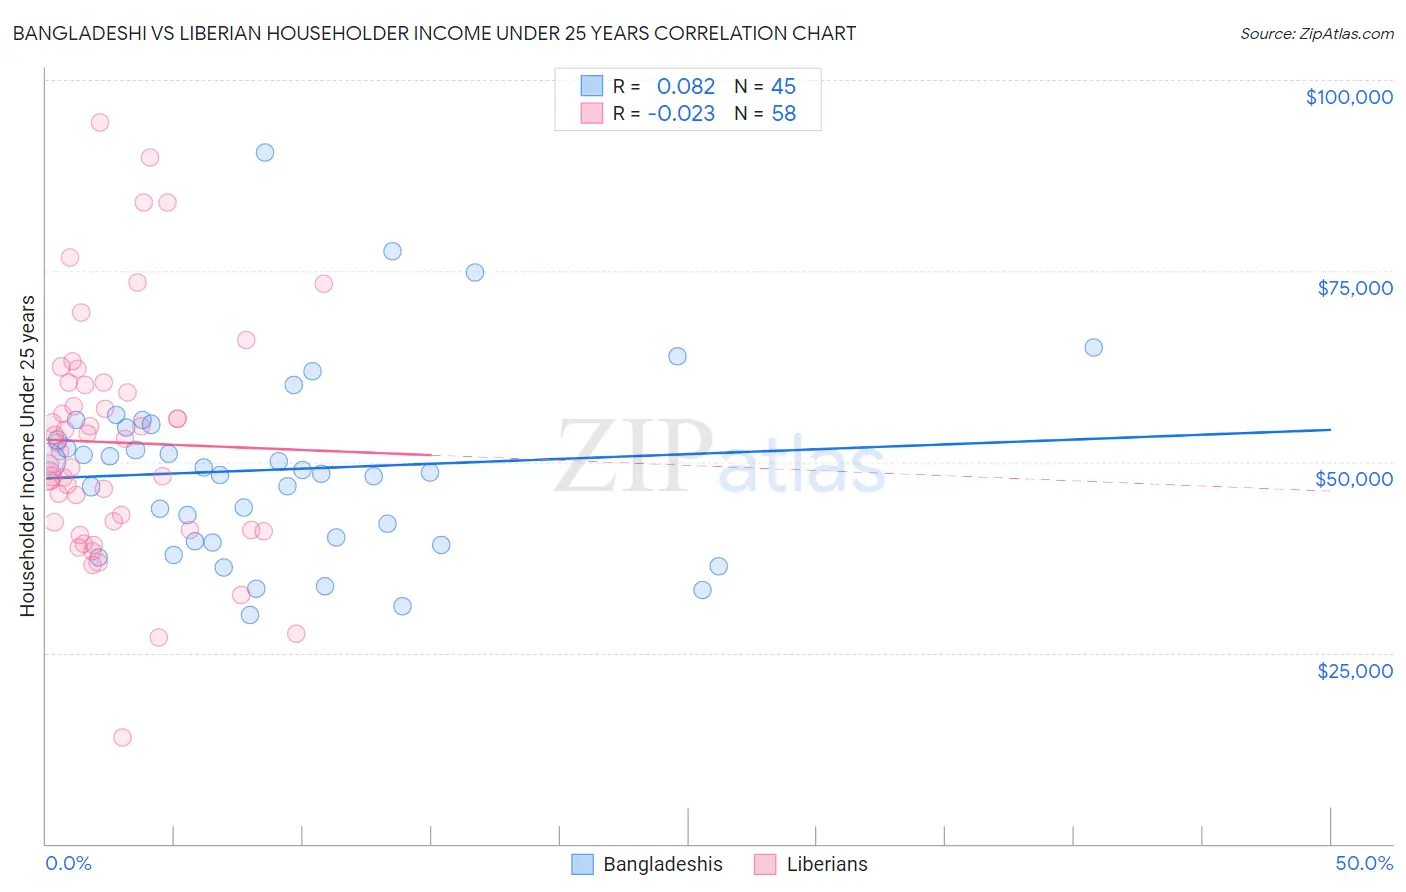
Bangladeshi vs Liberian Householder Income Under 25 years Correlation Chart
The statistical analysis conducted on geographies consisting of 131,389,647 people shows a slight positive correlation between the proportion of Bangladeshis and household income with householder under the age of 25 in the United States with a correlation coefficient (R) of 0.082 and weighted average of $47,589. Similarly, the statistical analysis conducted on geographies consisting of 110,653,679 people shows no correlation between the proportion of Liberians and household income with householder under the age of 25 in the United States with a correlation coefficient (R) of -0.023 and weighted average of $48,917, a difference of 2.8%.
Householder Income Under 25 years Correlation Summary
| Measurement | Bangladeshi | Liberian |
| Minimum | $29,883 | $13,942 |
| Maximum | $90,583 | $94,479 |
| Range | $60,700 | $80,537 |
| Mean | $49,001 | $52,552 |
| Median | $48,654 | $51,943 |
| Interquartile 25% (IQ1) | $39,531 | $42,067 |
| Interquartile 75% (IQ3) | $54,671 | $60,104 |
| Interquartile Range (IQR) | $15,140 | $18,037 |
| Standard Deviation (Sample) | $12,360 | $15,238 |
| Standard Deviation (Population) | $12,222 | $15,106 |
Demographics Similar to Bangladeshis and Liberians by Householder Income Under 25 years
In terms of householder income under 25 years, the demographic groups most similar to Bangladeshis are Native/Alaskan ($47,704, a difference of 0.24%), Cherokee ($47,848, a difference of 0.55%), Menominee ($47,907, a difference of 0.67%), Immigrants from Middle Africa ($47,916, a difference of 0.69%), and Immigrants from Liberia ($47,981, a difference of 0.82%). Similarly, the demographic groups most similar to Liberians are Honduran ($48,885, a difference of 0.060%), Senegalese ($48,953, a difference of 0.070%), American ($48,860, a difference of 0.12%), Immigrants from Burma/Myanmar ($48,749, a difference of 0.34%), and Shoshone ($48,720, a difference of 0.40%).
| Demographics | Rating | Rank | Householder Income Under 25 years |
| Senegalese | 0.0 /100 | #287 | Tragic $48,953 |
| Liberians | 0.0 /100 | #288 | Tragic $48,917 |
| Hondurans | 0.0 /100 | #289 | Tragic $48,885 |
| Americans | 0.0 /100 | #290 | Tragic $48,860 |
| Immigrants | Burma/Myanmar | 0.0 /100 | #291 | Tragic $48,749 |
| Shoshone | 0.0 /100 | #292 | Tragic $48,720 |
| Sub-Saharan Africans | 0.0 /100 | #293 | Tragic $48,691 |
| Somalis | 0.0 /100 | #294 | Tragic $48,657 |
| Central American Indians | 0.0 /100 | #295 | Tragic $48,643 |
| Blackfeet | 0.0 /100 | #296 | Tragic $48,603 |
| Cree | 0.0 /100 | #297 | Tragic $48,514 |
| Yaqui | 0.0 /100 | #298 | Tragic $48,300 |
| Immigrants | Honduras | 0.0 /100 | #299 | Tragic $48,267 |
| Immigrants | Somalia | 0.0 /100 | #300 | Tragic $48,135 |
| Immigrants | Kuwait | 0.0 /100 | #301 | Tragic $48,126 |
| Immigrants | Liberia | 0.0 /100 | #302 | Tragic $47,981 |
| Immigrants | Middle Africa | 0.0 /100 | #303 | Tragic $47,916 |
| Menominee | 0.0 /100 | #304 | Tragic $47,907 |
| Cherokee | 0.0 /100 | #305 | Tragic $47,848 |
| Natives/Alaskans | 0.0 /100 | #306 | Tragic $47,704 |
| Bangladeshis | 0.0 /100 | #307 | Tragic $47,589 |