Immigrants from Switzerland vs Immigrants from Iran Median Family Income
COMPARE
Immigrants from Switzerland
Immigrants from Iran
Median Family Income
Median Family Income Comparison
Immigrants from Switzerland
Immigrants from Iran
$120,726
MEDIAN FAMILY INCOME
100.0/ 100
METRIC RATING
26th/ 347
METRIC RANK
$130,894
MEDIAN FAMILY INCOME
100.0/ 100
METRIC RATING
8th/ 347
METRIC RANK
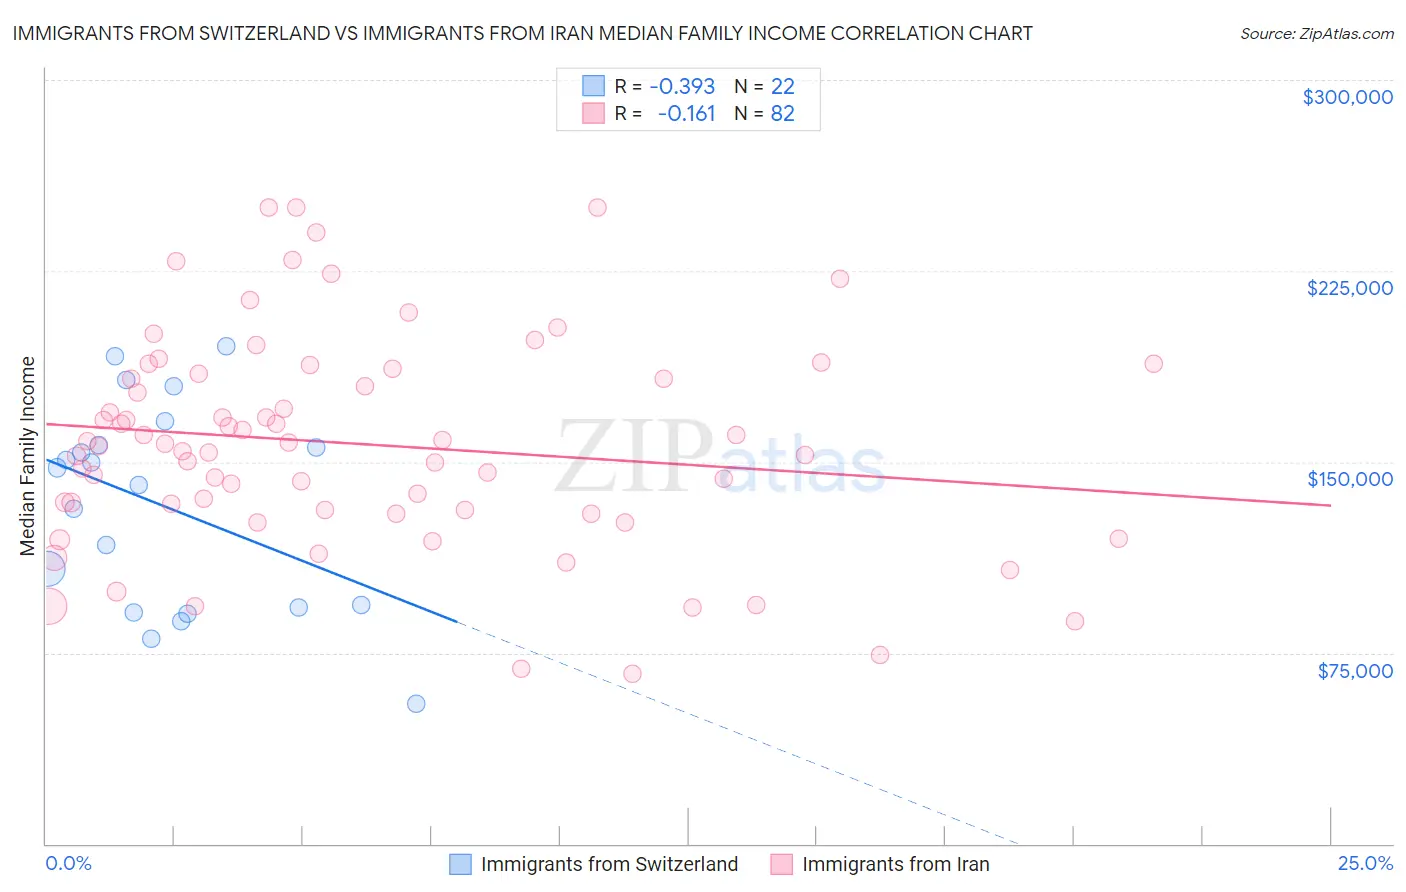
Immigrants from Switzerland vs Immigrants from Iran Median Family Income Correlation Chart
The statistical analysis conducted on geographies consisting of 148,050,158 people shows a mild negative correlation between the proportion of Immigrants from Switzerland and median family income in the United States with a correlation coefficient (R) of -0.393 and weighted average of $120,726. Similarly, the statistical analysis conducted on geographies consisting of 279,798,585 people shows a poor negative correlation between the proportion of Immigrants from Iran and median family income in the United States with a correlation coefficient (R) of -0.161 and weighted average of $130,894, a difference of 8.4%.
Median Family Income Correlation Summary
| Measurement | Immigrants from Switzerland | Immigrants from Iran |
| Minimum | $55,000 | $66,897 |
| Maximum | $195,586 | $250,001 |
| Range | $140,586 | $183,104 |
| Mean | $132,599 | $156,930 |
| Median | $144,292 | $156,641 |
| Interquartile 25% (IQ1) | $92,813 | $131,095 |
| Interquartile 75% (IQ3) | $156,420 | $184,731 |
| Interquartile Range (IQR) | $63,607 | $53,637 |
| Standard Deviation (Sample) | $40,204 | $42,072 |
| Standard Deviation (Population) | $39,280 | $41,815 |
Demographics Similar to Immigrants from Switzerland and Immigrants from Iran by Median Family Income
In terms of median family income, the demographic groups most similar to Immigrants from Switzerland are Russian ($120,487, a difference of 0.20%), Turkish ($121,202, a difference of 0.39%), Immigrants from Northern Europe ($121,840, a difference of 0.92%), Immigrants from Sweden ($122,765, a difference of 1.7%), and Immigrants from Japan ($122,764, a difference of 1.7%). Similarly, the demographic groups most similar to Immigrants from Iran are Immigrants from Hong Kong ($131,067, a difference of 0.13%), Okinawan ($129,979, a difference of 0.70%), Immigrants from Ireland ($127,584, a difference of 2.6%), Immigrants from Israel ($127,430, a difference of 2.7%), and Cypriot ($127,064, a difference of 3.0%).
| Demographics | Rating | Rank | Median Family Income |
| Immigrants | Hong Kong | 100.0 /100 | #7 | Exceptional $131,067 |
| Immigrants | Iran | 100.0 /100 | #8 | Exceptional $130,894 |
| Okinawans | 100.0 /100 | #9 | Exceptional $129,979 |
| Immigrants | Ireland | 100.0 /100 | #10 | Exceptional $127,584 |
| Immigrants | Israel | 100.0 /100 | #11 | Exceptional $127,430 |
| Cypriots | 100.0 /100 | #12 | Exceptional $127,064 |
| Immigrants | Australia | 100.0 /100 | #13 | Exceptional $126,620 |
| Immigrants | South Central Asia | 100.0 /100 | #14 | Exceptional $125,956 |
| Eastern Europeans | 100.0 /100 | #15 | Exceptional $125,546 |
| Immigrants | China | 100.0 /100 | #16 | Exceptional $125,540 |
| Indians (Asian) | 100.0 /100 | #17 | Exceptional $125,312 |
| Immigrants | Eastern Asia | 100.0 /100 | #18 | Exceptional $125,150 |
| Immigrants | Belgium | 100.0 /100 | #19 | Exceptional $123,831 |
| Burmese | 100.0 /100 | #20 | Exceptional $123,369 |
| Immigrants | Korea | 100.0 /100 | #21 | Exceptional $122,800 |
| Immigrants | Sweden | 100.0 /100 | #22 | Exceptional $122,765 |
| Immigrants | Japan | 100.0 /100 | #23 | Exceptional $122,764 |
| Immigrants | Northern Europe | 100.0 /100 | #24 | Exceptional $121,840 |
| Turks | 100.0 /100 | #25 | Exceptional $121,202 |
| Immigrants | Switzerland | 100.0 /100 | #26 | Exceptional $120,726 |
| Russians | 100.0 /100 | #27 | Exceptional $120,487 |