Portuguese vs Immigrants from Albania Median Family Income
COMPARE
Portuguese
Immigrants from Albania
Median Family Income
Median Family Income Comparison
Portuguese
Immigrants from Albania
$106,286
MEDIAN FAMILY INCOME
86.3/ 100
METRIC RATING
135th/ 347
METRIC RANK
$105,285
MEDIAN FAMILY INCOME
79.1/ 100
METRIC RATING
152nd/ 347
METRIC RANK
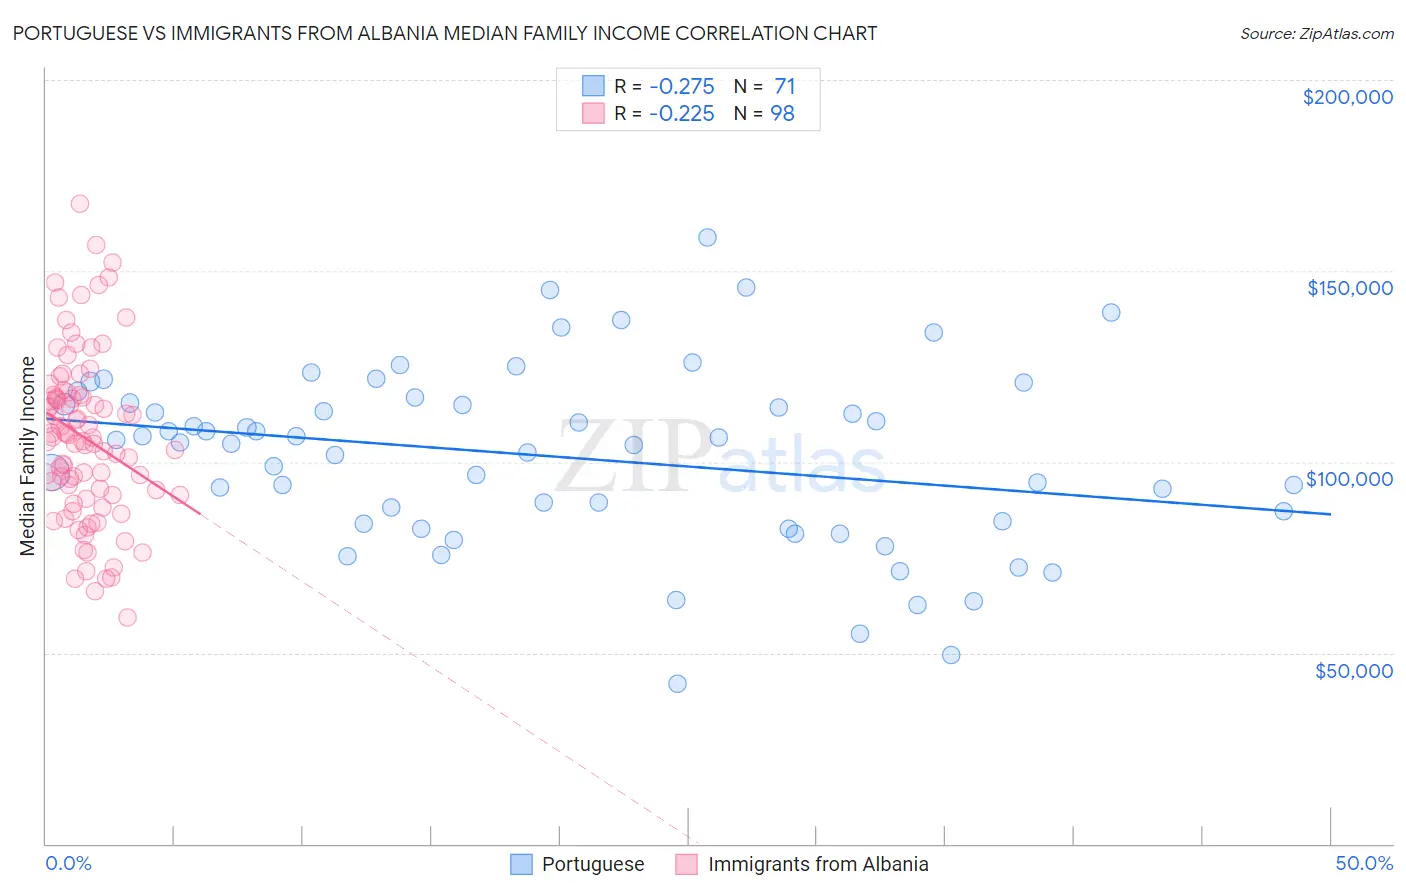
Portuguese vs Immigrants from Albania Median Family Income Correlation Chart
The statistical analysis conducted on geographies consisting of 449,790,054 people shows a weak negative correlation between the proportion of Portuguese and median family income in the United States with a correlation coefficient (R) of -0.275 and weighted average of $106,286. Similarly, the statistical analysis conducted on geographies consisting of 119,337,318 people shows a weak negative correlation between the proportion of Immigrants from Albania and median family income in the United States with a correlation coefficient (R) of -0.225 and weighted average of $105,285, a difference of 0.95%.
Median Family Income Correlation Summary
| Measurement | Portuguese | Immigrants from Albania |
| Minimum | $41,875 | $59,250 |
| Maximum | $158,667 | $167,526 |
| Range | $116,792 | $108,276 |
| Mean | $101,290 | $106,367 |
| Median | $105,008 | $106,522 |
| Interquartile 25% (IQ1) | $83,759 | $91,250 |
| Interquartile 75% (IQ3) | $115,390 | $117,507 |
| Interquartile Range (IQR) | $31,631 | $26,257 |
| Standard Deviation (Sample) | $23,601 | $21,718 |
| Standard Deviation (Population) | $23,434 | $21,607 |
Demographics Similar to Portuguese and Immigrants from Albania by Median Family Income
In terms of median family income, the demographic groups most similar to Portuguese are Immigrants from South Eastern Asia ($106,252, a difference of 0.030%), Immigrants from Uganda ($106,188, a difference of 0.090%), Immigrants from Vietnam ($106,186, a difference of 0.090%), Luxembourger ($106,183, a difference of 0.10%), and Norwegian ($106,144, a difference of 0.13%). Similarly, the demographic groups most similar to Immigrants from Albania are Slavic ($105,144, a difference of 0.13%), Peruvian ($105,444, a difference of 0.15%), Irish ($105,453, a difference of 0.16%), Immigrants from Germany ($105,507, a difference of 0.21%), and Hungarian ($105,609, a difference of 0.31%).
| Demographics | Rating | Rank | Median Family Income |
| Ugandans | 87.8 /100 | #133 | Excellent $106,541 |
| Immigrants | Oceania | 87.3 /100 | #134 | Excellent $106,453 |
| Portuguese | 86.3 /100 | #135 | Excellent $106,286 |
| Immigrants | South Eastern Asia | 86.1 /100 | #136 | Excellent $106,252 |
| Immigrants | Uganda | 85.7 /100 | #137 | Excellent $106,188 |
| Immigrants | Vietnam | 85.7 /100 | #138 | Excellent $106,186 |
| Luxembourgers | 85.7 /100 | #139 | Excellent $106,183 |
| Norwegians | 85.5 /100 | #140 | Excellent $106,144 |
| Immigrants | Syria | 85.3 /100 | #141 | Excellent $106,118 |
| Slovenes | 84.7 /100 | #142 | Excellent $106,020 |
| Tongans | 84.3 /100 | #143 | Excellent $105,967 |
| Immigrants | Morocco | 84.3 /100 | #144 | Excellent $105,964 |
| Danes | 83.8 /100 | #145 | Excellent $105,900 |
| Czechs | 83.4 /100 | #146 | Excellent $105,839 |
| Immigrants | Chile | 82.1 /100 | #147 | Excellent $105,655 |
| Hungarians | 81.7 /100 | #148 | Excellent $105,609 |
| Immigrants | Germany | 80.9 /100 | #149 | Excellent $105,507 |
| Irish | 80.5 /100 | #150 | Excellent $105,453 |
| Peruvians | 80.4 /100 | #151 | Excellent $105,444 |
| Immigrants | Albania | 79.1 /100 | #152 | Good $105,285 |
| Slavs | 77.9 /100 | #153 | Good $105,144 |