Paraguayan vs Immigrants from Czechoslovakia Householder Income Ages 45 - 64 years
COMPARE
Paraguayan
Immigrants from Czechoslovakia
Householder Income Ages 45 - 64 years
Householder Income Ages 45 - 64 years Comparison
Paraguayans
Immigrants from Czechoslovakia
$109,447
HOUSEHOLDER INCOME AGES 45 - 64 YEARS
99.0/ 100
METRIC RATING
76th/ 347
METRIC RANK
$111,914
HOUSEHOLDER INCOME AGES 45 - 64 YEARS
99.7/ 100
METRIC RATING
61st/ 347
METRIC RANK
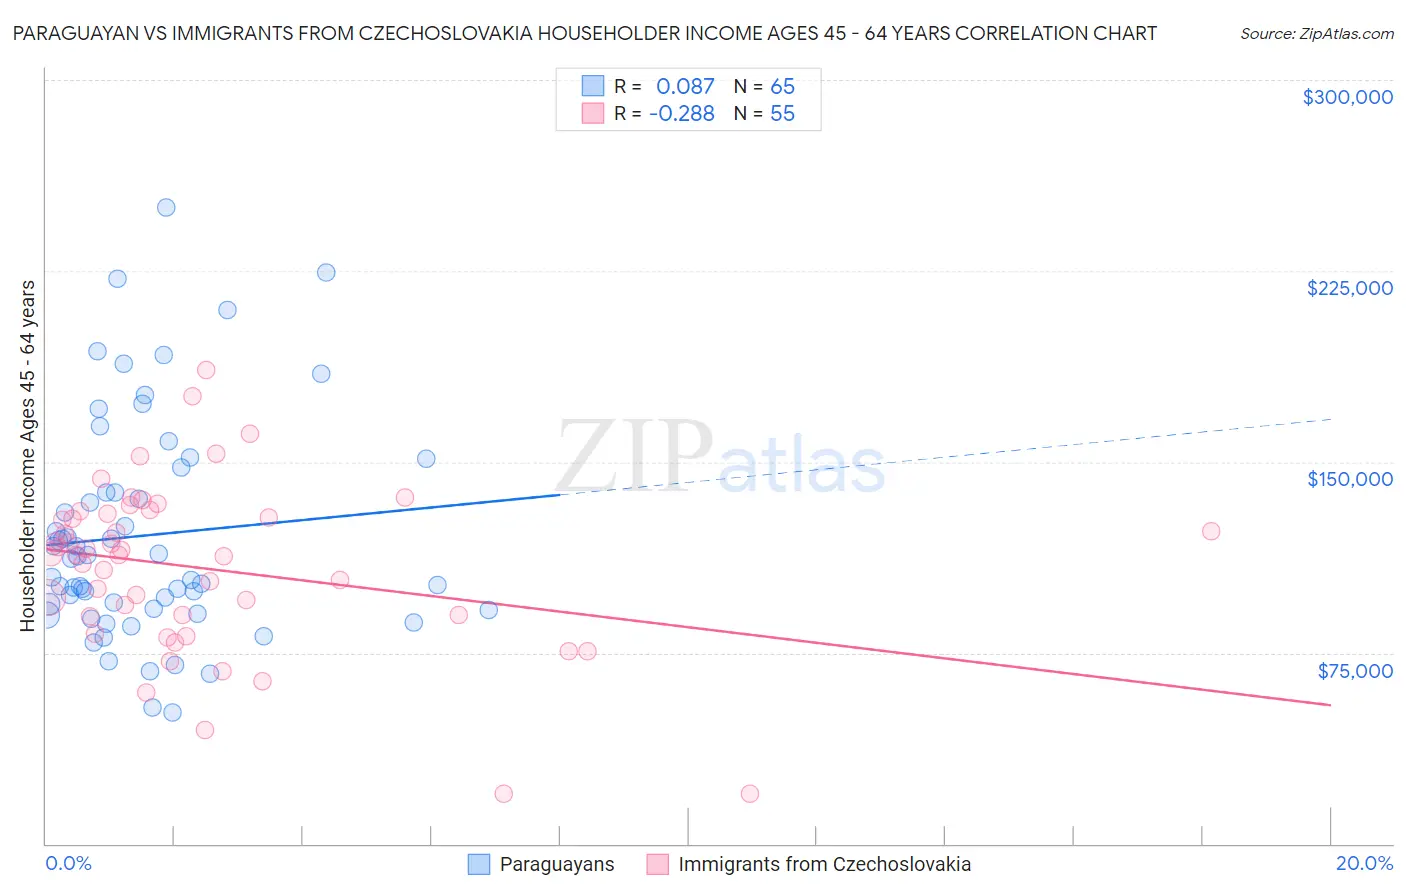
Paraguayan vs Immigrants from Czechoslovakia Householder Income Ages 45 - 64 years Correlation Chart
The statistical analysis conducted on geographies consisting of 95,076,993 people shows a slight positive correlation between the proportion of Paraguayans and household income with householder between the ages 45 and 64 in the United States with a correlation coefficient (R) of 0.087 and weighted average of $109,447. Similarly, the statistical analysis conducted on geographies consisting of 195,371,868 people shows a weak negative correlation between the proportion of Immigrants from Czechoslovakia and household income with householder between the ages 45 and 64 in the United States with a correlation coefficient (R) of -0.288 and weighted average of $111,914, a difference of 2.2%.
Householder Income Ages 45 - 64 years Correlation Summary
| Measurement | Paraguayan | Immigrants from Czechoslovakia |
| Minimum | $51,563 | $19,531 |
| Maximum | $250,001 | $185,944 |
| Range | $198,438 | $166,413 |
| Mean | $121,175 | $108,047 |
| Median | $112,144 | $113,601 |
| Interquartile 25% (IQ1) | $91,944 | $89,542 |
| Interquartile 75% (IQ3) | $142,851 | $129,527 |
| Interquartile Range (IQR) | $50,906 | $39,985 |
| Standard Deviation (Sample) | $43,262 | $33,291 |
| Standard Deviation (Population) | $42,927 | $32,987 |
Demographics Similar to Paraguayans and Immigrants from Czechoslovakia by Householder Income Ages 45 - 64 years
In terms of householder income ages 45 - 64 years, the demographic groups most similar to Paraguayans are Immigrants from England ($109,446, a difference of 0.0%), Immigrants from Canada ($109,402, a difference of 0.040%), South African ($109,719, a difference of 0.25%), Immigrants from Egypt ($109,941, a difference of 0.45%), and Argentinean ($110,103, a difference of 0.60%). Similarly, the demographic groups most similar to Immigrants from Czechoslovakia are Immigrants from Europe ($111,984, a difference of 0.060%), Immigrants from Netherlands ($111,982, a difference of 0.060%), Soviet Union ($112,008, a difference of 0.080%), Immigrants from Norway ($111,669, a difference of 0.22%), and Mongolian ($111,602, a difference of 0.28%).
| Demographics | Rating | Rank | Householder Income Ages 45 - 64 years |
| Soviet Union | 99.7 /100 | #58 | Exceptional $112,008 |
| Immigrants | Europe | 99.7 /100 | #59 | Exceptional $111,984 |
| Immigrants | Netherlands | 99.7 /100 | #60 | Exceptional $111,982 |
| Immigrants | Czechoslovakia | 99.7 /100 | #61 | Exceptional $111,914 |
| Immigrants | Norway | 99.7 /100 | #62 | Exceptional $111,669 |
| Mongolians | 99.6 /100 | #63 | Exceptional $111,602 |
| Immigrants | Latvia | 99.6 /100 | #64 | Exceptional $111,454 |
| Immigrants | Belarus | 99.6 /100 | #65 | Exceptional $111,430 |
| New Zealanders | 99.6 /100 | #66 | Exceptional $111,286 |
| Laotians | 99.5 /100 | #67 | Exceptional $111,051 |
| Immigrants | Romania | 99.4 /100 | #68 | Exceptional $110,633 |
| Immigrants | Italy | 99.4 /100 | #69 | Exceptional $110,434 |
| Koreans | 99.3 /100 | #70 | Exceptional $110,334 |
| Italians | 99.3 /100 | #71 | Exceptional $110,224 |
| Assyrians/Chaldeans/Syriacs | 99.3 /100 | #72 | Exceptional $110,201 |
| Argentineans | 99.3 /100 | #73 | Exceptional $110,103 |
| Immigrants | Egypt | 99.2 /100 | #74 | Exceptional $109,941 |
| South Africans | 99.1 /100 | #75 | Exceptional $109,719 |
| Paraguayans | 99.0 /100 | #76 | Exceptional $109,447 |
| Immigrants | England | 99.0 /100 | #77 | Exceptional $109,446 |
| Immigrants | Canada | 99.0 /100 | #78 | Exceptional $109,402 |