Panamanian vs Immigrants from Senegal 3rd Grade
COMPARE
Panamanian
Immigrants from Senegal
3rd Grade
3rd Grade Comparison
Panamanians
Immigrants from Senegal
97.7%
3RD GRADE
31.5/ 100
METRIC RATING
190th/ 347
METRIC RANK
97.4%
3RD GRADE
1.0/ 100
METRIC RATING
246th/ 347
METRIC RANK
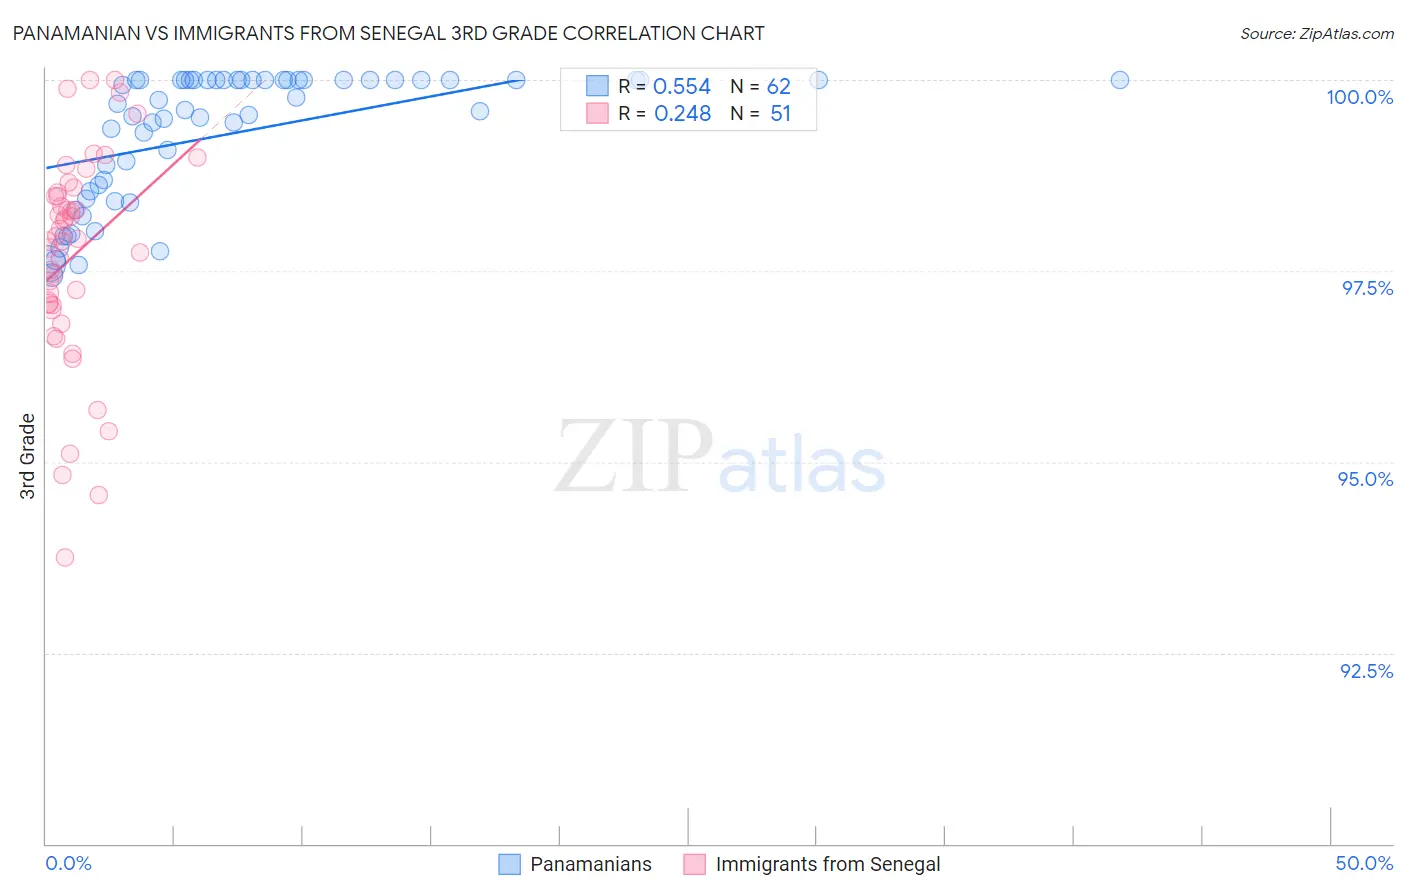
Panamanian vs Immigrants from Senegal 3rd Grade Correlation Chart
The statistical analysis conducted on geographies consisting of 281,248,945 people shows a substantial positive correlation between the proportion of Panamanians and percentage of population with at least 3rd grade education in the United States with a correlation coefficient (R) of 0.554 and weighted average of 97.7%. Similarly, the statistical analysis conducted on geographies consisting of 90,126,273 people shows a weak positive correlation between the proportion of Immigrants from Senegal and percentage of population with at least 3rd grade education in the United States with a correlation coefficient (R) of 0.248 and weighted average of 97.4%, a difference of 0.33%.
3rd Grade Correlation Summary
| Measurement | Panamanian | Immigrants from Senegal |
| Minimum | 97.4% | 93.7% |
| Maximum | 100.0% | 100.0% |
| Range | 2.6% | 6.3% |
| Mean | 99.3% | 97.7% |
| Median | 99.6% | 97.9% |
| Interquartile 25% (IQ1) | 98.5% | 97.1% |
| Interquartile 75% (IQ3) | 100.0% | 98.5% |
| Interquartile Range (IQR) | 1.5% | 1.5% |
| Standard Deviation (Sample) | 0.85% | 1.4% |
| Standard Deviation (Population) | 0.85% | 1.4% |
Similar Demographics by 3rd Grade
Demographics Similar to Panamanians by 3rd Grade
In terms of 3rd grade, the demographic groups most similar to Panamanians are Native/Alaskan (97.7%, a difference of 0.010%), Immigrants from Taiwan (97.7%, a difference of 0.010%), Pakistani (97.7%, a difference of 0.010%), Black/African American (97.7%, a difference of 0.010%), and Mongolian (97.7%, a difference of 0.010%).
| Demographics | Rating | Rank | 3rd Grade |
| Arabs | 40.0 /100 | #183 | Fair 97.7% |
| Immigrants | Kazakhstan | 37.4 /100 | #184 | Fair 97.7% |
| Immigrants | Argentina | 37.0 /100 | #185 | Fair 97.7% |
| Portuguese | 36.2 /100 | #186 | Fair 97.7% |
| Natives/Alaskans | 35.2 /100 | #187 | Fair 97.7% |
| Immigrants | Taiwan | 34.2 /100 | #188 | Fair 97.7% |
| Pakistanis | 34.2 /100 | #189 | Fair 97.7% |
| Panamanians | 31.5 /100 | #190 | Fair 97.7% |
| Blacks/African Americans | 29.6 /100 | #191 | Fair 97.7% |
| Mongolians | 29.1 /100 | #192 | Fair 97.7% |
| Immigrants | Kenya | 28.2 /100 | #193 | Fair 97.7% |
| Immigrants | Uganda | 27.4 /100 | #194 | Fair 97.7% |
| Immigrants | Egypt | 26.8 /100 | #195 | Fair 97.7% |
| Paraguayans | 26.2 /100 | #196 | Fair 97.7% |
| Hawaiians | 25.7 /100 | #197 | Fair 97.7% |
Demographics Similar to Immigrants from Senegal by 3rd Grade
In terms of 3rd grade, the demographic groups most similar to Immigrants from Senegal are Assyrian/Chaldean/Syriac (97.4%, a difference of 0.0%), Asian (97.4%, a difference of 0.010%), Ethiopian (97.4%, a difference of 0.010%), Immigrants from Eastern Africa (97.4%, a difference of 0.010%), and South American (97.4%, a difference of 0.010%).
| Demographics | Rating | Rank | 3rd Grade |
| Nigerians | 1.6 /100 | #239 | Tragic 97.4% |
| U.S. Virgin Islanders | 1.4 /100 | #240 | Tragic 97.4% |
| Immigrants | Indonesia | 1.4 /100 | #241 | Tragic 97.4% |
| Koreans | 1.3 /100 | #242 | Tragic 97.4% |
| Indians (Asian) | 1.3 /100 | #243 | Tragic 97.4% |
| Asians | 1.1 /100 | #244 | Tragic 97.4% |
| Ethiopians | 1.1 /100 | #245 | Tragic 97.4% |
| Immigrants | Senegal | 1.0 /100 | #246 | Tragic 97.4% |
| Assyrians/Chaldeans/Syriacs | 1.0 /100 | #247 | Tragic 97.4% |
| Immigrants | Eastern Africa | 0.9 /100 | #248 | Tragic 97.4% |
| South Americans | 0.9 /100 | #249 | Tragic 97.4% |
| Immigrants | Middle Africa | 0.9 /100 | #250 | Tragic 97.4% |
| Immigrants | Asia | 0.8 /100 | #251 | Tragic 97.4% |
| Peruvians | 0.8 /100 | #252 | Tragic 97.4% |
| Immigrants | Africa | 0.8 /100 | #253 | Tragic 97.4% |