Palestinian vs Immigrants from Philippines Householder Income Over 65 years
COMPARE
Palestinian
Immigrants from Philippines
Householder Income Over 65 years
Householder Income Over 65 years Comparison
Palestinians
Immigrants from Philippines
$63,800
HOUSEHOLDER INCOME OVER 65 YEARS
95.1/ 100
METRIC RATING
108th/ 347
METRIC RANK
$66,161
HOUSEHOLDER INCOME OVER 65 YEARS
99.6/ 100
METRIC RATING
58th/ 347
METRIC RANK
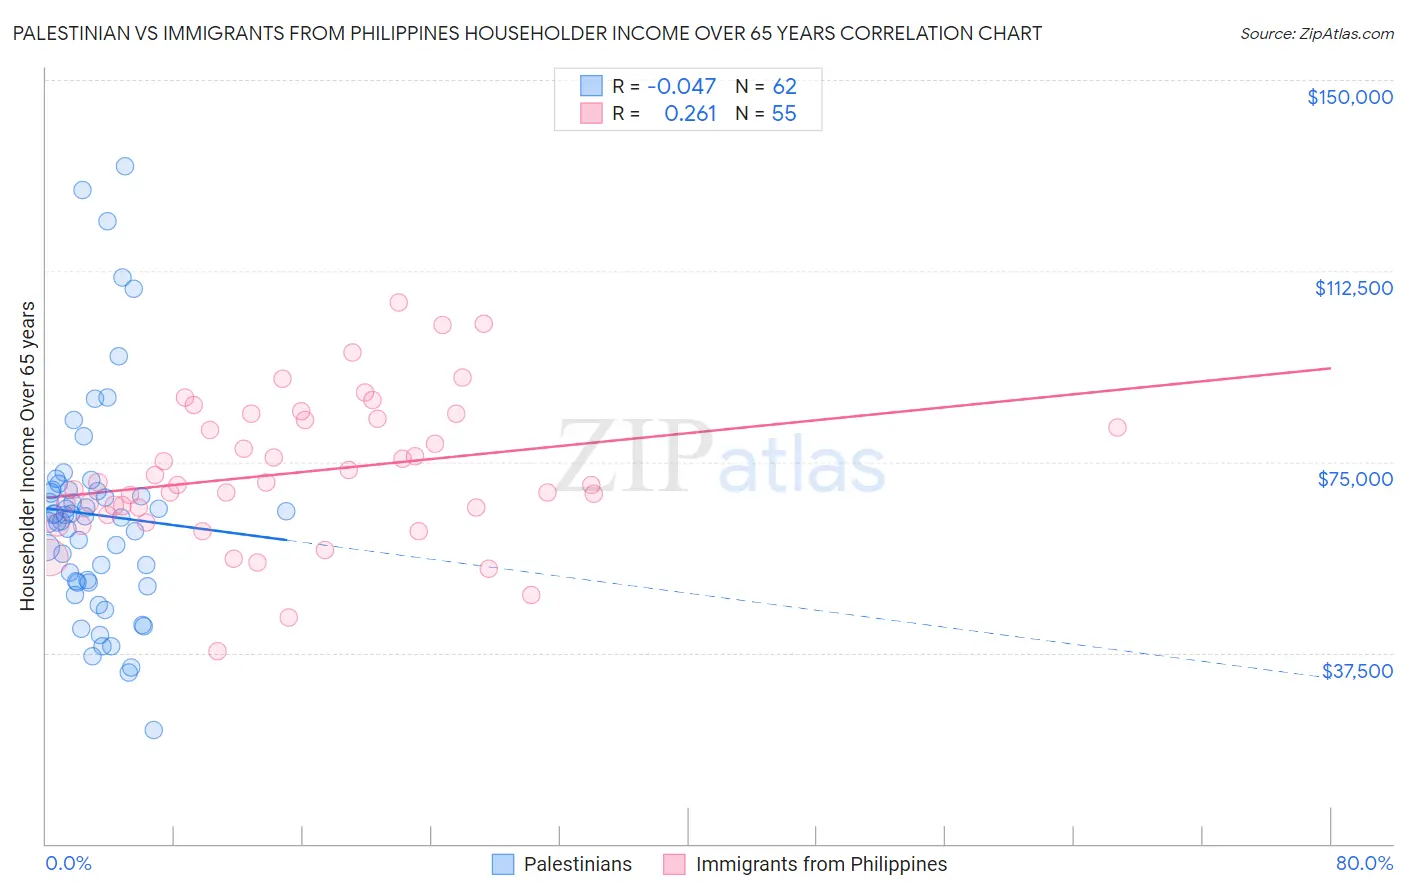
Palestinian vs Immigrants from Philippines Householder Income Over 65 years Correlation Chart
The statistical analysis conducted on geographies consisting of 216,153,975 people shows no correlation between the proportion of Palestinians and household income with householder over the age of 65 in the United States with a correlation coefficient (R) of -0.047 and weighted average of $63,800. Similarly, the statistical analysis conducted on geographies consisting of 469,098,262 people shows a weak positive correlation between the proportion of Immigrants from Philippines and household income with householder over the age of 65 in the United States with a correlation coefficient (R) of 0.261 and weighted average of $66,161, a difference of 3.7%.
Householder Income Over 65 years Correlation Summary
| Measurement | Palestinian | Immigrants from Philippines |
| Minimum | $22,303 | $37,713 |
| Maximum | $133,182 | $106,262 |
| Range | $110,879 | $68,549 |
| Mean | $64,585 | $72,886 |
| Median | $64,219 | $70,497 |
| Interquartile 25% (IQ1) | $51,418 | $64,489 |
| Interquartile 75% (IQ3) | $69,430 | $83,466 |
| Interquartile Range (IQR) | $18,012 | $18,977 |
| Standard Deviation (Sample) | $21,891 | $14,178 |
| Standard Deviation (Population) | $21,714 | $14,049 |
Similar Demographics by Householder Income Over 65 years
Demographics Similar to Palestinians by Householder Income Over 65 years
In terms of householder income over 65 years, the demographic groups most similar to Palestinians are European ($63,779, a difference of 0.030%), Pakistani ($63,844, a difference of 0.070%), Italian ($63,885, a difference of 0.13%), Immigrants from Argentina ($63,885, a difference of 0.13%), and Immigrants from Cameroon ($63,907, a difference of 0.17%).
| Demographics | Rating | Rank | Householder Income Over 65 years |
| Immigrants | Italy | 96.2 /100 | #101 | Exceptional $64,065 |
| Chileans | 95.8 /100 | #102 | Exceptional $63,957 |
| British | 95.7 /100 | #103 | Exceptional $63,940 |
| Immigrants | Cameroon | 95.6 /100 | #104 | Exceptional $63,907 |
| Italians | 95.5 /100 | #105 | Exceptional $63,885 |
| Immigrants | Argentina | 95.5 /100 | #106 | Exceptional $63,885 |
| Pakistanis | 95.3 /100 | #107 | Exceptional $63,844 |
| Palestinians | 95.1 /100 | #108 | Exceptional $63,800 |
| Europeans | 95.0 /100 | #109 | Exceptional $63,779 |
| Immigrants | Zimbabwe | 94.3 /100 | #110 | Exceptional $63,643 |
| Immigrants | Spain | 93.7 /100 | #111 | Exceptional $63,540 |
| Syrians | 93.4 /100 | #112 | Exceptional $63,494 |
| Immigrants | Serbia | 92.7 /100 | #113 | Exceptional $63,387 |
| Immigrants | Saudi Arabia | 92.4 /100 | #114 | Exceptional $63,355 |
| Croatians | 91.4 /100 | #115 | Exceptional $63,225 |
Demographics Similar to Immigrants from Philippines by Householder Income Over 65 years
In terms of householder income over 65 years, the demographic groups most similar to Immigrants from Philippines are Immigrants from Norway ($66,118, a difference of 0.060%), Bulgarian ($66,236, a difference of 0.11%), Immigrants from Lithuania ($66,087, a difference of 0.11%), Maltese ($66,027, a difference of 0.20%), and Laotian ($66,306, a difference of 0.22%).
| Demographics | Rating | Rank | Householder Income Over 65 years |
| Israelis | 99.7 /100 | #51 | Exceptional $66,636 |
| Immigrants | Scotland | 99.7 /100 | #52 | Exceptional $66,620 |
| Immigrants | Pakistan | 99.7 /100 | #53 | Exceptional $66,617 |
| Immigrants | Netherlands | 99.7 /100 | #54 | Exceptional $66,463 |
| Immigrants | Czechoslovakia | 99.7 /100 | #55 | Exceptional $66,376 |
| Laotians | 99.6 /100 | #56 | Exceptional $66,306 |
| Bulgarians | 99.6 /100 | #57 | Exceptional $66,236 |
| Immigrants | Philippines | 99.6 /100 | #58 | Exceptional $66,161 |
| Immigrants | Norway | 99.5 /100 | #59 | Exceptional $66,118 |
| Immigrants | Lithuania | 99.5 /100 | #60 | Exceptional $66,087 |
| Maltese | 99.5 /100 | #61 | Exceptional $66,027 |
| Immigrants | Sierra Leone | 99.5 /100 | #62 | Exceptional $66,009 |
| Marshallese | 99.4 /100 | #63 | Exceptional $65,874 |
| Zimbabweans | 99.4 /100 | #64 | Exceptional $65,854 |
| Immigrants | England | 99.3 /100 | #65 | Exceptional $65,715 |