Japanese vs Immigrants from Philippines Householder Income Over 65 years
COMPARE
Japanese
Immigrants from Philippines
Householder Income Over 65 years
Householder Income Over 65 years Comparison
Japanese
Immigrants from Philippines
$57,919
HOUSEHOLDER INCOME OVER 65 YEARS
3.9/ 100
METRIC RATING
227th/ 347
METRIC RANK
$66,161
HOUSEHOLDER INCOME OVER 65 YEARS
99.6/ 100
METRIC RATING
58th/ 347
METRIC RANK
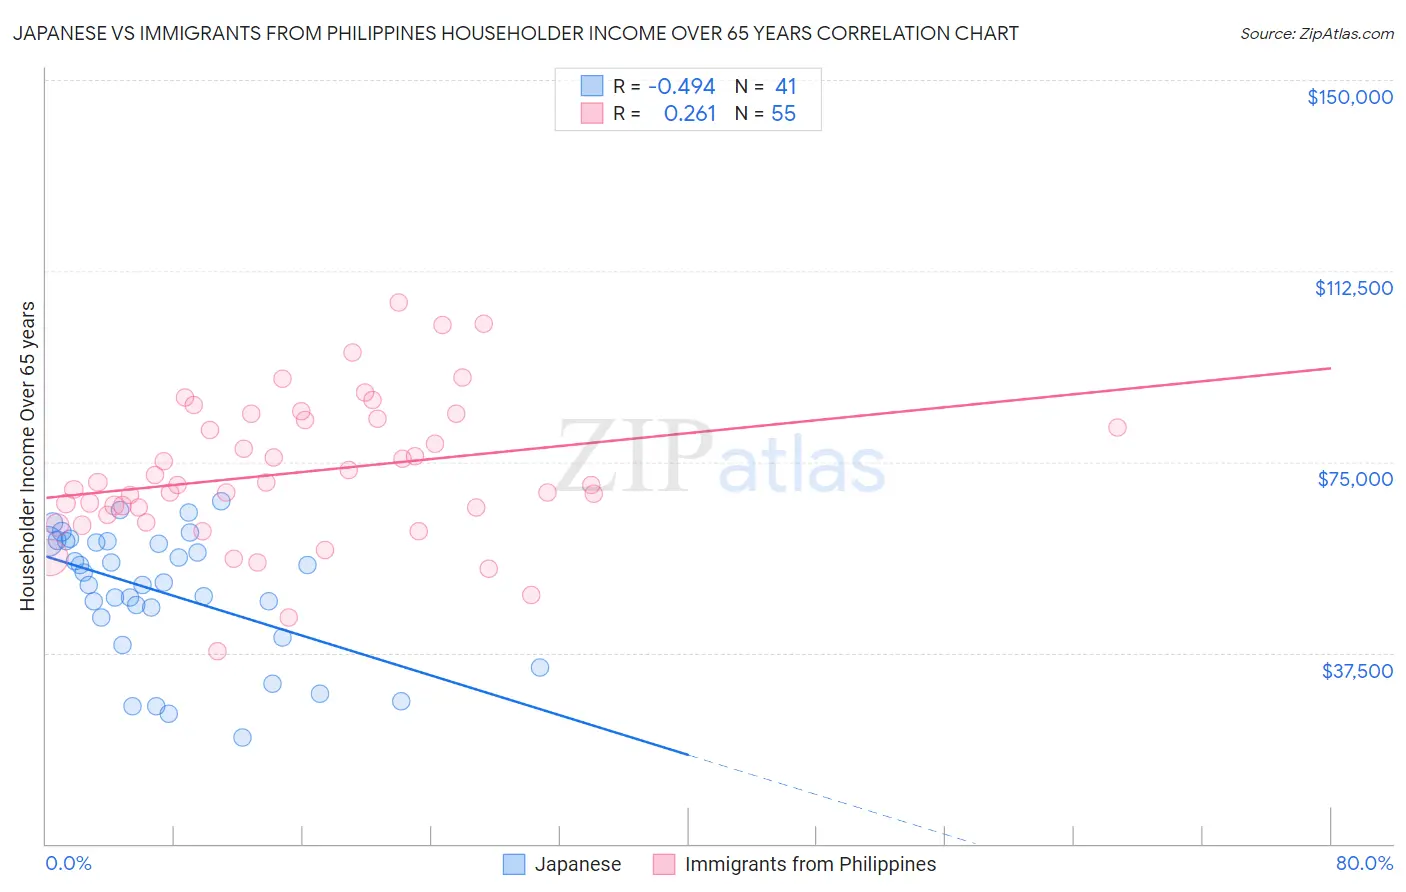
Japanese vs Immigrants from Philippines Householder Income Over 65 years Correlation Chart
The statistical analysis conducted on geographies consisting of 248,642,327 people shows a moderate negative correlation between the proportion of Japanese and household income with householder over the age of 65 in the United States with a correlation coefficient (R) of -0.494 and weighted average of $57,919. Similarly, the statistical analysis conducted on geographies consisting of 469,098,262 people shows a weak positive correlation between the proportion of Immigrants from Philippines and household income with householder over the age of 65 in the United States with a correlation coefficient (R) of 0.261 and weighted average of $66,161, a difference of 14.2%.
Householder Income Over 65 years Correlation Summary
| Measurement | Japanese | Immigrants from Philippines |
| Minimum | $20,958 | $37,713 |
| Maximum | $67,267 | $106,262 |
| Range | $46,309 | $68,549 |
| Mean | $49,288 | $72,886 |
| Median | $51,375 | $70,497 |
| Interquartile 25% (IQ1) | $42,447 | $64,489 |
| Interquartile 75% (IQ3) | $59,385 | $83,466 |
| Interquartile Range (IQR) | $16,939 | $18,977 |
| Standard Deviation (Sample) | $12,523 | $14,178 |
| Standard Deviation (Population) | $12,369 | $14,049 |
Similar Demographics by Householder Income Over 65 years
Demographics Similar to Japanese by Householder Income Over 65 years
In terms of householder income over 65 years, the demographic groups most similar to Japanese are French Canadian ($57,975, a difference of 0.10%), Immigrants from Albania ($57,828, a difference of 0.16%), Venezuelan ($58,026, a difference of 0.18%), Bermudan ($58,171, a difference of 0.43%), and Immigrants from Colombia ($57,658, a difference of 0.45%).
| Demographics | Rating | Rank | Householder Income Over 65 years |
| Yugoslavians | 5.5 /100 | #220 | Tragic $58,243 |
| Immigrants | El Salvador | 5.4 /100 | #221 | Tragic $58,226 |
| Delaware | 5.3 /100 | #222 | Tragic $58,214 |
| Tsimshian | 5.2 /100 | #223 | Tragic $58,202 |
| Bermudans | 5.1 /100 | #224 | Tragic $58,171 |
| Venezuelans | 4.4 /100 | #225 | Tragic $58,026 |
| French Canadians | 4.2 /100 | #226 | Tragic $57,975 |
| Japanese | 3.9 /100 | #227 | Tragic $57,919 |
| Immigrants | Albania | 3.6 /100 | #228 | Tragic $57,828 |
| Immigrants | Colombia | 3.0 /100 | #229 | Tragic $57,658 |
| Immigrants | Cambodia | 2.8 /100 | #230 | Tragic $57,580 |
| Immigrants | Nonimmigrants | 2.4 /100 | #231 | Tragic $57,426 |
| Immigrants | Venezuela | 2.3 /100 | #232 | Tragic $57,371 |
| Immigrants | Western Africa | 1.7 /100 | #233 | Tragic $57,119 |
| Immigrants | Burma/Myanmar | 1.7 /100 | #234 | Tragic $57,114 |
Demographics Similar to Immigrants from Philippines by Householder Income Over 65 years
In terms of householder income over 65 years, the demographic groups most similar to Immigrants from Philippines are Immigrants from Norway ($66,118, a difference of 0.060%), Bulgarian ($66,236, a difference of 0.11%), Immigrants from Lithuania ($66,087, a difference of 0.11%), Maltese ($66,027, a difference of 0.20%), and Laotian ($66,306, a difference of 0.22%).
| Demographics | Rating | Rank | Householder Income Over 65 years |
| Israelis | 99.7 /100 | #51 | Exceptional $66,636 |
| Immigrants | Scotland | 99.7 /100 | #52 | Exceptional $66,620 |
| Immigrants | Pakistan | 99.7 /100 | #53 | Exceptional $66,617 |
| Immigrants | Netherlands | 99.7 /100 | #54 | Exceptional $66,463 |
| Immigrants | Czechoslovakia | 99.7 /100 | #55 | Exceptional $66,376 |
| Laotians | 99.6 /100 | #56 | Exceptional $66,306 |
| Bulgarians | 99.6 /100 | #57 | Exceptional $66,236 |
| Immigrants | Philippines | 99.6 /100 | #58 | Exceptional $66,161 |
| Immigrants | Norway | 99.5 /100 | #59 | Exceptional $66,118 |
| Immigrants | Lithuania | 99.5 /100 | #60 | Exceptional $66,087 |
| Maltese | 99.5 /100 | #61 | Exceptional $66,027 |
| Immigrants | Sierra Leone | 99.5 /100 | #62 | Exceptional $66,009 |
| Marshallese | 99.4 /100 | #63 | Exceptional $65,874 |
| Zimbabweans | 99.4 /100 | #64 | Exceptional $65,854 |
| Immigrants | England | 99.3 /100 | #65 | Exceptional $65,715 |