Palestinian vs Immigrants from South Central Asia Householder Income Over 65 years
COMPARE
Palestinian
Immigrants from South Central Asia
Householder Income Over 65 years
Householder Income Over 65 years Comparison
Palestinians
Immigrants from South Central Asia
$63,800
HOUSEHOLDER INCOME OVER 65 YEARS
95.1/ 100
METRIC RATING
108th/ 347
METRIC RANK
$70,103
HOUSEHOLDER INCOME OVER 65 YEARS
100.0/ 100
METRIC RATING
20th/ 347
METRIC RANK
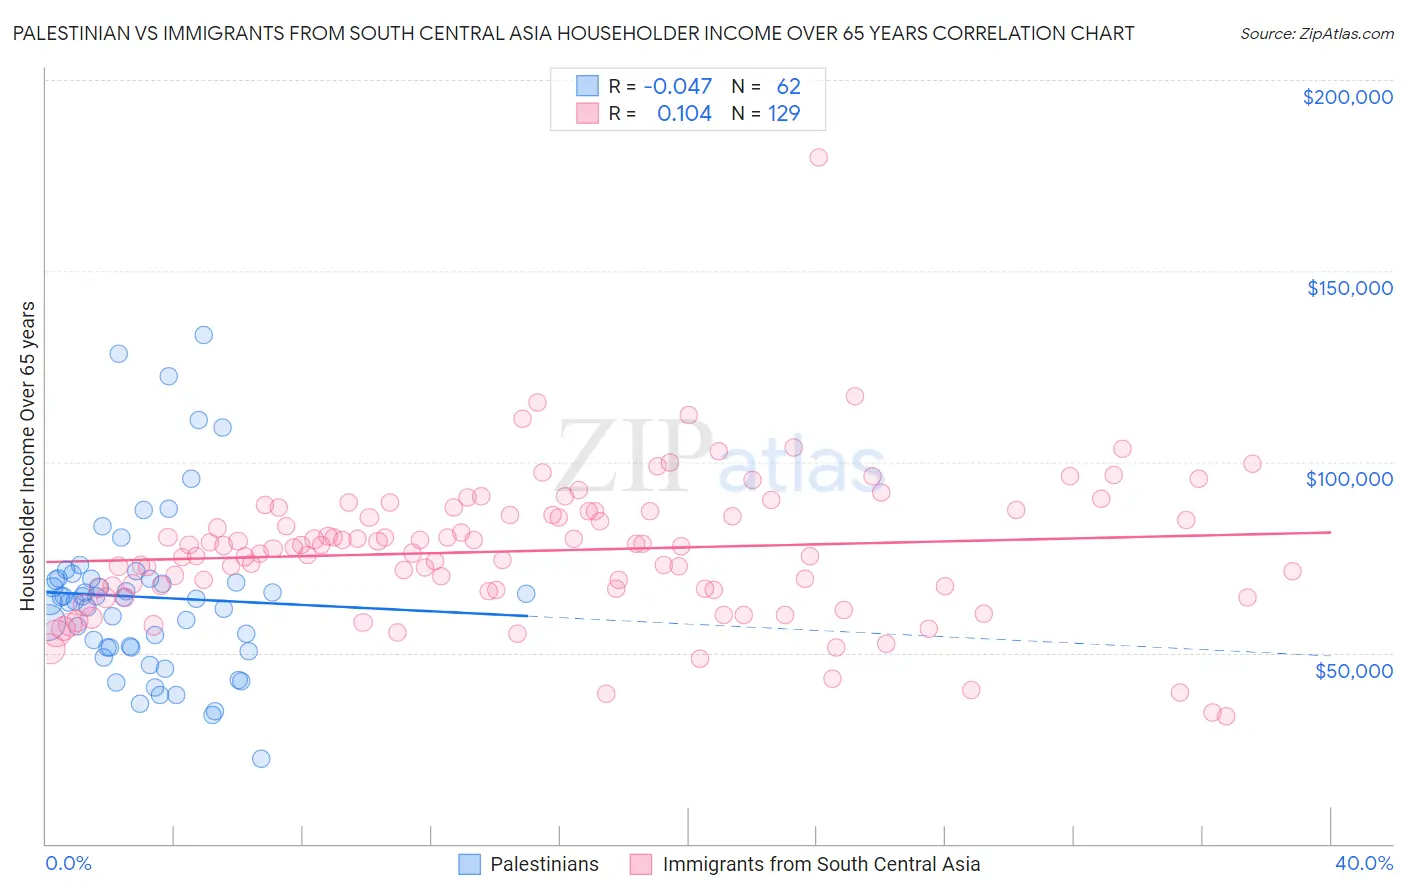
Palestinian vs Immigrants from South Central Asia Householder Income Over 65 years Correlation Chart
The statistical analysis conducted on geographies consisting of 216,153,975 people shows no correlation between the proportion of Palestinians and household income with householder over the age of 65 in the United States with a correlation coefficient (R) of -0.047 and weighted average of $63,800. Similarly, the statistical analysis conducted on geographies consisting of 470,970,472 people shows a poor positive correlation between the proportion of Immigrants from South Central Asia and household income with householder over the age of 65 in the United States with a correlation coefficient (R) of 0.104 and weighted average of $70,103, a difference of 9.9%.
Householder Income Over 65 years Correlation Summary
| Measurement | Palestinian | Immigrants from South Central Asia |
| Minimum | $22,303 | $33,500 |
| Maximum | $133,182 | $179,808 |
| Range | $110,879 | $146,308 |
| Mean | $64,585 | $76,705 |
| Median | $64,219 | $77,625 |
| Interquartile 25% (IQ1) | $51,418 | $66,593 |
| Interquartile 75% (IQ3) | $69,430 | $87,098 |
| Interquartile Range (IQR) | $18,012 | $20,505 |
| Standard Deviation (Sample) | $21,891 | $18,654 |
| Standard Deviation (Population) | $21,714 | $18,582 |
Similar Demographics by Householder Income Over 65 years
Demographics Similar to Palestinians by Householder Income Over 65 years
In terms of householder income over 65 years, the demographic groups most similar to Palestinians are European ($63,779, a difference of 0.030%), Pakistani ($63,844, a difference of 0.070%), Italian ($63,885, a difference of 0.13%), Immigrants from Argentina ($63,885, a difference of 0.13%), and Immigrants from Cameroon ($63,907, a difference of 0.17%).
| Demographics | Rating | Rank | Householder Income Over 65 years |
| Immigrants | Italy | 96.2 /100 | #101 | Exceptional $64,065 |
| Chileans | 95.8 /100 | #102 | Exceptional $63,957 |
| British | 95.7 /100 | #103 | Exceptional $63,940 |
| Immigrants | Cameroon | 95.6 /100 | #104 | Exceptional $63,907 |
| Italians | 95.5 /100 | #105 | Exceptional $63,885 |
| Immigrants | Argentina | 95.5 /100 | #106 | Exceptional $63,885 |
| Pakistanis | 95.3 /100 | #107 | Exceptional $63,844 |
| Palestinians | 95.1 /100 | #108 | Exceptional $63,800 |
| Europeans | 95.0 /100 | #109 | Exceptional $63,779 |
| Immigrants | Zimbabwe | 94.3 /100 | #110 | Exceptional $63,643 |
| Immigrants | Spain | 93.7 /100 | #111 | Exceptional $63,540 |
| Syrians | 93.4 /100 | #112 | Exceptional $63,494 |
| Immigrants | Serbia | 92.7 /100 | #113 | Exceptional $63,387 |
| Immigrants | Saudi Arabia | 92.4 /100 | #114 | Exceptional $63,355 |
| Croatians | 91.4 /100 | #115 | Exceptional $63,225 |
Demographics Similar to Immigrants from South Central Asia by Householder Income Over 65 years
In terms of householder income over 65 years, the demographic groups most similar to Immigrants from South Central Asia are Indian (Asian) ($70,238, a difference of 0.19%), Immigrants from Eastern Asia ($69,872, a difference of 0.33%), Immigrants from Israel ($69,857, a difference of 0.35%), Immigrants from Japan ($69,774, a difference of 0.47%), and Eastern European ($70,470, a difference of 0.52%).
| Demographics | Rating | Rank | Householder Income Over 65 years |
| Immigrants | Hong Kong | 100.0 /100 | #13 | Exceptional $71,567 |
| Burmese | 100.0 /100 | #14 | Exceptional $71,139 |
| Native Hawaiians | 100.0 /100 | #15 | Exceptional $71,021 |
| Okinawans | 100.0 /100 | #16 | Exceptional $70,846 |
| Immigrants | Korea | 100.0 /100 | #17 | Exceptional $70,696 |
| Eastern Europeans | 100.0 /100 | #18 | Exceptional $70,470 |
| Indians (Asian) | 100.0 /100 | #19 | Exceptional $70,238 |
| Immigrants | South Central Asia | 100.0 /100 | #20 | Exceptional $70,103 |
| Immigrants | Eastern Asia | 100.0 /100 | #21 | Exceptional $69,872 |
| Immigrants | Israel | 100.0 /100 | #22 | Exceptional $69,857 |
| Immigrants | Japan | 100.0 /100 | #23 | Exceptional $69,774 |
| Immigrants | Sweden | 100.0 /100 | #24 | Exceptional $69,722 |
| Immigrants | Belgium | 100.0 /100 | #25 | Exceptional $69,703 |
| Immigrants | Sri Lanka | 100.0 /100 | #26 | Exceptional $69,426 |
| Immigrants | Switzerland | 100.0 /100 | #27 | Exceptional $69,343 |