Immigrants from Russia vs Yaqui Median Female Earnings
COMPARE
Immigrants from Russia
Yaqui
Median Female Earnings
Median Female Earnings Comparison
Immigrants from Russia
Yaqui
$44,680
MEDIAN FEMALE EARNINGS
100.0/ 100
METRIC RATING
28th/ 347
METRIC RANK
$34,943
MEDIAN FEMALE EARNINGS
0.0/ 100
METRIC RATING
312th/ 347
METRIC RANK
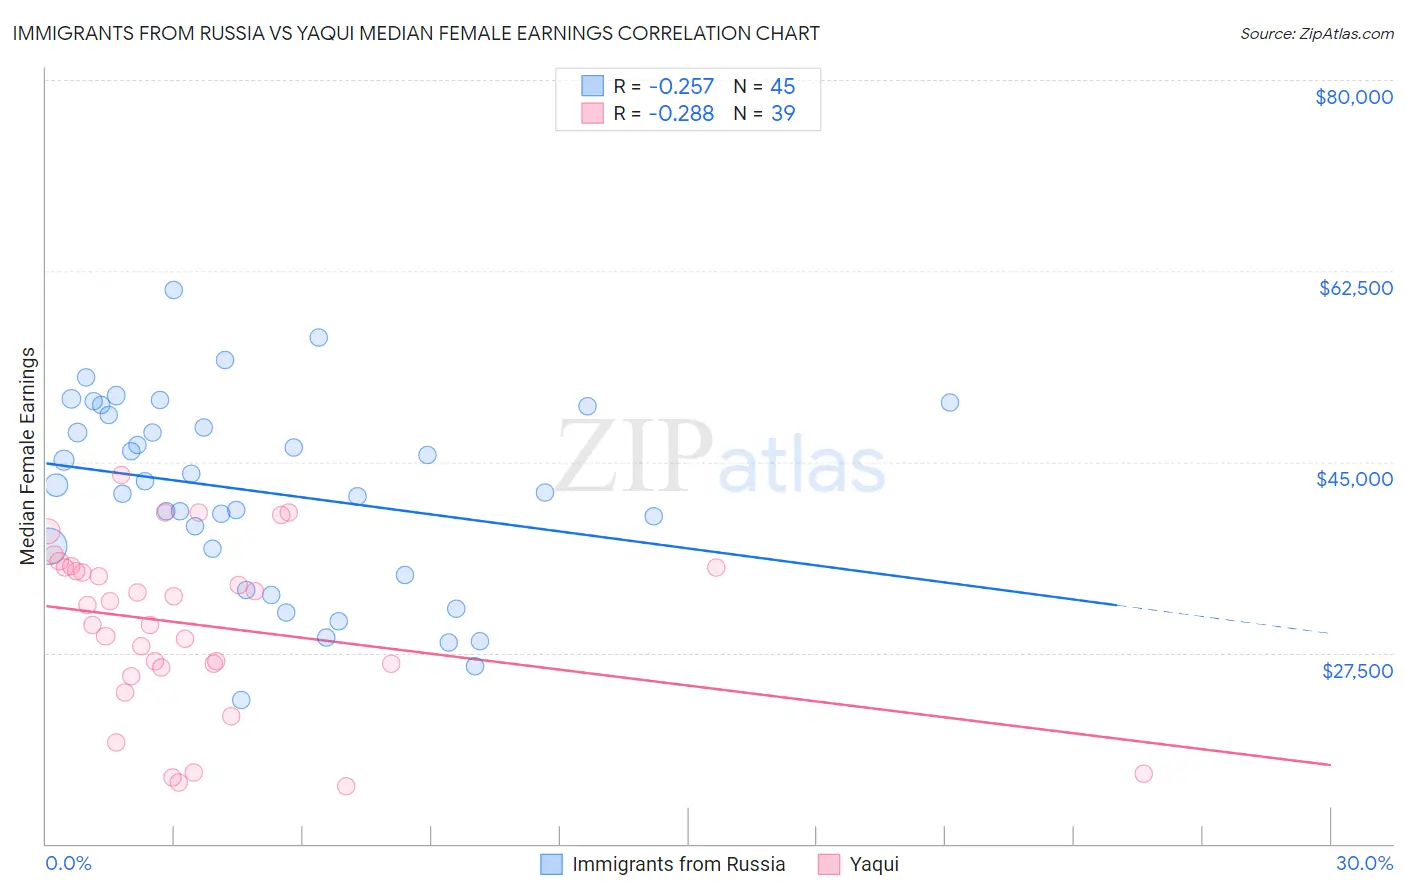
Immigrants from Russia vs Yaqui Median Female Earnings Correlation Chart
The statistical analysis conducted on geographies consisting of 347,839,336 people shows a weak negative correlation between the proportion of Immigrants from Russia and median female earnings in the United States with a correlation coefficient (R) of -0.257 and weighted average of $44,680. Similarly, the statistical analysis conducted on geographies consisting of 107,698,351 people shows a weak negative correlation between the proportion of Yaqui and median female earnings in the United States with a correlation coefficient (R) of -0.288 and weighted average of $34,943, a difference of 27.9%.
Median Female Earnings Correlation Summary
| Measurement | Immigrants from Russia | Yaqui |
| Minimum | $23,199 | $15,284 |
| Maximum | $60,754 | $43,787 |
| Range | $37,555 | $28,503 |
| Mean | $42,242 | $30,052 |
| Median | $42,848 | $31,854 |
| Interquartile 25% (IQ1) | $35,838 | $26,190 |
| Interquartile 75% (IQ3) | $49,732 | $35,336 |
| Interquartile Range (IQR) | $13,894 | $9,146 |
| Standard Deviation (Sample) | $8,738 | $7,719 |
| Standard Deviation (Population) | $8,640 | $7,619 |
Similar Demographics by Median Female Earnings
Demographics Similar to Immigrants from Russia by Median Female Earnings
In terms of median female earnings, the demographic groups most similar to Immigrants from Russia are Turkish ($44,695, a difference of 0.030%), Immigrants from Belarus ($44,757, a difference of 0.17%), Immigrants from Sweden ($44,774, a difference of 0.21%), Immigrants from Belgium ($44,587, a difference of 0.21%), and Asian ($44,586, a difference of 0.21%).
| Demographics | Rating | Rank | Median Female Earnings |
| Cambodians | 100.0 /100 | #21 | Exceptional $45,014 |
| Immigrants | Greece | 100.0 /100 | #22 | Exceptional $44,976 |
| Burmese | 100.0 /100 | #23 | Exceptional $44,911 |
| Immigrants | Korea | 100.0 /100 | #24 | Exceptional $44,847 |
| Immigrants | Sweden | 100.0 /100 | #25 | Exceptional $44,774 |
| Immigrants | Belarus | 100.0 /100 | #26 | Exceptional $44,757 |
| Turks | 100.0 /100 | #27 | Exceptional $44,695 |
| Immigrants | Russia | 100.0 /100 | #28 | Exceptional $44,680 |
| Immigrants | Belgium | 100.0 /100 | #29 | Exceptional $44,587 |
| Asians | 100.0 /100 | #30 | Exceptional $44,586 |
| Immigrants | France | 100.0 /100 | #31 | Exceptional $44,541 |
| Immigrants | Northern Europe | 100.0 /100 | #32 | Exceptional $44,366 |
| Immigrants | Asia | 100.0 /100 | #33 | Exceptional $44,198 |
| Russians | 100.0 /100 | #34 | Exceptional $44,169 |
| Immigrants | Sri Lanka | 100.0 /100 | #35 | Exceptional $44,161 |
Demographics Similar to Yaqui by Median Female Earnings
In terms of median female earnings, the demographic groups most similar to Yaqui are Cuban ($34,942, a difference of 0.0%), Ute ($34,960, a difference of 0.050%), Apache ($34,895, a difference of 0.14%), Chippewa ($35,003, a difference of 0.17%), and Honduran ($35,013, a difference of 0.20%).
| Demographics | Rating | Rank | Median Female Earnings |
| Bahamians | 0.0 /100 | #305 | Tragic $35,125 |
| Fijians | 0.0 /100 | #306 | Tragic $35,114 |
| Sioux | 0.0 /100 | #307 | Tragic $35,063 |
| Immigrants | Bahamas | 0.0 /100 | #308 | Tragic $35,027 |
| Hondurans | 0.0 /100 | #309 | Tragic $35,013 |
| Chippewa | 0.0 /100 | #310 | Tragic $35,003 |
| Ute | 0.0 /100 | #311 | Tragic $34,960 |
| Yaqui | 0.0 /100 | #312 | Tragic $34,943 |
| Cubans | 0.0 /100 | #313 | Tragic $34,942 |
| Apache | 0.0 /100 | #314 | Tragic $34,895 |
| Pennsylvania Germans | 0.0 /100 | #315 | Tragic $34,802 |
| Cherokee | 0.0 /100 | #316 | Tragic $34,742 |
| Potawatomi | 0.0 /100 | #317 | Tragic $34,739 |
| Immigrants | Yemen | 0.0 /100 | #318 | Tragic $34,693 |
| Shoshone | 0.0 /100 | #319 | Tragic $34,677 |