Nonimmigrants vs Immigrants from Bahamas Unemployment Among Seniors over 75 years

COMPARE

Nonimmigrants
Race
Ancestry
AfghanAfricanAlaska NativeAlaskan AthabascanAlbanianAleutAlsatianAmericanApacheArabArapahoArgentineanArmenianAssyrian/Chaldean/SyriacAustralianAustrianBahamianBangladeshiBarbadianBasqueBelgianBelizeanBermudanBhutaneseBlackfeetBolivianBrazilianBritishBritish West IndianBulgarianBurmeseCajunCambodianCanadianCape VerdeanCarpatho RusynCelticCentral AmericanCentral American IndianCherokeeCheyenneChickasawChileanChineseChippewaChoctawColombianColvilleComancheCosta RicanCreeCreekCroatianCrowCubanCypriotCzechCzechoslovakianDanishDelawareDominicanDutchDutch West IndianEastern EuropeanEcuadorianEgyptianEnglishEstonianEthiopianEuropeanFijianFilipinoFinnishFrenchFrench American IndianFrench CanadianGermanGerman RussianGhanaianGreekGuamanian/ChamorroGuatemalanGuyaneseHaitianHmongHonduranHopiHoumaHungarianIcelanderIndian (Asian)IndonesianInupiatIranianIraqiIrishIroquoisIsraeliItalianJamaicanJapaneseJordanianKenyanKiowaKoreanLaotianLatvianLebaneseLiberianLithuanianLumbeeLuxembourgerMacedonianMalaysianMalteseMarshalleseMexicanMexican American IndianMongolianMoroccanNative HawaiianNavajoNepaleseNew ZealanderNicaraguanNigerianNorthern EuropeanNorwegianOkinawanOsageOttawaPaiutePakistaniPalestinianPanamanianParaguayanPennsylvania GermanPeruvianPimaPolishPortuguesePotawatomiPuebloPuerto RicanPuget Sound SalishRomanianRussianSalvadoranSamoanScandinavianScotch-IrishScottishSeminoleSenegaleseSerbianShoshoneSierra LeoneanSiouxSlavicSlovakSloveneSomaliSouth AfricanSouth AmericanSouth American IndianSoviet UnionSpaniardSpanishSpanish AmericanSpanish American IndianSri LankanSubsaharan AfricanSudaneseSwedishSwissSyrianTaiwaneseThaiTlingit-HaidaTohono O'OdhamTonganTrinidadian and TobagonianTsimshianTurkishU.S. Virgin IslanderUgandanUkrainianUruguayanUteVenezuelanVietnameseWelshWest IndianYakamaYaquiYugoslavianYumanYup'ikZimbabwean
Immigration
NonimmigrantsImmigrantsAfghanistanAfricaAlbaniaArgentinaArmeniaAsiaAustraliaAustriaBangladeshBarbadosBelarusBelgiumBelizeBoliviaBosnia and HerzegovinaBrazilBulgariaBurma/MyanmarCabo VerdeCambodiaCameroonCanadaCaribbeanCentral AmericaChileChinaColombiaCongoCosta RicaCroatiaCubaCzechoslovakiaDenmarkDominicaDominican RepublicEastern AfricaEastern AsiaEastern EuropeEcuadorEgyptEl SalvadorEnglandEritreaEthiopiaEuropeFijiFranceGermanyGhanaGreeceGrenadaGuatemalaGuyanaHaitiHondurasHong KongHungaryIndiaIndonesiaIranIraqIrelandIsraelItalyJamaicaJapanJordanKazakhstanKenyaKoreaKuwaitLaosLatin AmericaLatviaLebanonLiberiaLithuaniaMalaysiaMexicoMicronesiaMiddle AfricaMoldovaMoroccoNepalNetherlandsNicaraguaNigeriaNorth AmericaNorth MacedoniaNorthern AfricaNorthern EuropeNorwayOceaniaPakistanPanamaPeruPhilippinesPolandPortugalRomaniaRussiaSaudi ArabiaScotlandSenegalSerbiaSierra LeoneSingaporeSomaliaSouth AfricaSouth AmericaSouth Central AsiaSouth Eastern AsiaSouthern EuropeSpainSri LankaSt. Vincent and the GrenadinesSudanSwedenSwitzerlandSyriaTaiwanThailandTrinidad and TobagoTurkeyUgandaUkraineUruguayUzbekistanVenezuelaVietnamWest IndiesWestern AfricaWestern AsiaWestern EuropeYemenZaireZimbabweAzores
Immigrants from Bahamas
Race
Ancestry
AfghanAfricanAlaska NativeAlaskan AthabascanAlbanianAleutAlsatianAmericanApacheArabArapahoArgentineanArmenianAssyrian/Chaldean/SyriacAustralianAustrianBahamianBangladeshiBarbadianBasqueBelgianBelizeanBermudanBhutaneseBlackfeetBolivianBrazilianBritishBritish West IndianBulgarianBurmeseCajunCambodianCanadianCape VerdeanCarpatho RusynCelticCentral AmericanCentral American IndianCherokeeCheyenneChickasawChileanChineseChippewaChoctawColombianColvilleComancheCosta RicanCreeCreekCroatianCrowCubanCypriotCzechCzechoslovakianDanishDelawareDominicanDutchDutch West IndianEastern EuropeanEcuadorianEgyptianEnglishEstonianEthiopianEuropeanFijianFilipinoFinnishFrenchFrench American IndianFrench CanadianGermanGerman RussianGhanaianGreekGuamanian/ChamorroGuatemalanGuyaneseHaitianHmongHonduranHopiHoumaHungarianIcelanderIndian (Asian)IndonesianInupiatIranianIraqiIrishIroquoisIsraeliItalianJamaicanJapaneseJordanianKenyanKiowaKoreanLaotianLatvianLebaneseLiberianLithuanianLumbeeLuxembourgerMacedonianMalaysianMalteseMarshalleseMexicanMexican American IndianMongolianMoroccanNative HawaiianNavajoNepaleseNew ZealanderNicaraguanNigerianNorthern EuropeanNorwegianOkinawanOsageOttawaPaiutePakistaniPalestinianPanamanianParaguayanPennsylvania GermanPeruvianPimaPolishPortuguesePotawatomiPuebloPuerto RicanPuget Sound SalishRomanianRussianSalvadoranSamoanScandinavianScotch-IrishScottishSeminoleSenegaleseSerbianShoshoneSierra LeoneanSiouxSlavicSlovakSloveneSomaliSouth AfricanSouth AmericanSouth American IndianSoviet UnionSpaniardSpanishSpanish AmericanSpanish American IndianSri LankanSubsaharan AfricanSudaneseSwedishSwissSyrianTaiwaneseThaiTlingit-HaidaTohono O'OdhamTonganTrinidadian and TobagonianTsimshianTurkishU.S. Virgin IslanderUgandanUkrainianUruguayanUteVenezuelanVietnameseWelshWest IndianYakamaYaquiYugoslavianYumanYup'ikZimbabwean
Immigration
ImmigrantsAfghanistanAfricaAlbaniaArgentinaArmeniaAsiaAustraliaAustriaBahamasBangladeshBarbadosBelarusBelgiumBelizeBoliviaBosnia and HerzegovinaBrazilBulgariaBurma/MyanmarCabo VerdeCambodiaCameroonCanadaCaribbeanCentral AmericaChileChinaColombiaCongoCosta RicaCroatiaCubaCzechoslovakiaDenmarkDominicaDominican RepublicEastern AfricaEastern AsiaEastern EuropeEcuadorEgyptEl SalvadorEnglandEritreaEthiopiaEuropeFijiFranceGermanyGhanaGreeceGrenadaGuatemalaGuyanaHaitiHondurasHong KongHungaryIndiaIndonesiaIranIraqIrelandIsraelItalyJamaicaJapanJordanKazakhstanKenyaKoreaKuwaitLaosLatin AmericaLatviaLebanonLiberiaLithuaniaMalaysiaMexicoMicronesiaMiddle AfricaMoldovaMoroccoNepalNetherlandsNicaraguaNigeriaNorth AmericaNorth MacedoniaNorthern AfricaNorthern EuropeNorwayOceaniaPakistanPanamaPeruPhilippinesPolandPortugalRomaniaRussiaSaudi ArabiaScotlandSenegalSerbiaSierra LeoneSingaporeSomaliaSouth AfricaSouth AmericaSouth Central AsiaSouth Eastern AsiaSouthern EuropeSpainSri LankaSt. Vincent and the GrenadinesSudanSwedenSwitzerlandSyriaTaiwanThailandTrinidad and TobagoTurkeyUgandaUkraineUruguayUzbekistanVenezuelaVietnamWest IndiesWestern AfricaWestern AsiaWestern EuropeYemenZaireZimbabweAzores
Unemployment Among Seniors over 75 years
Income
Poverty
Unemployment
Labor Participation
Family Structure
Vehicle Availability
Education Level
Disability

Unemployment Among Seniors over 75 years Comparison

Nonimmigrants

Immigrants from Bahamas

Tragic
Good
9.8%
UNEMPLOYMENT AMONG SENIORS OVER 75 YEARS
0.0/ 100
METRIC RATING
295th/ 347
METRIC RANK
8.6%
UNEMPLOYMENT AMONG SENIORS OVER 75 YEARS
76.5/ 100
METRIC RATING
156th/ 347
METRIC RANK

Nonimmigrants vs Immigrants from Bahamas Unemployment Among Seniors over 75 years Correlation Chart

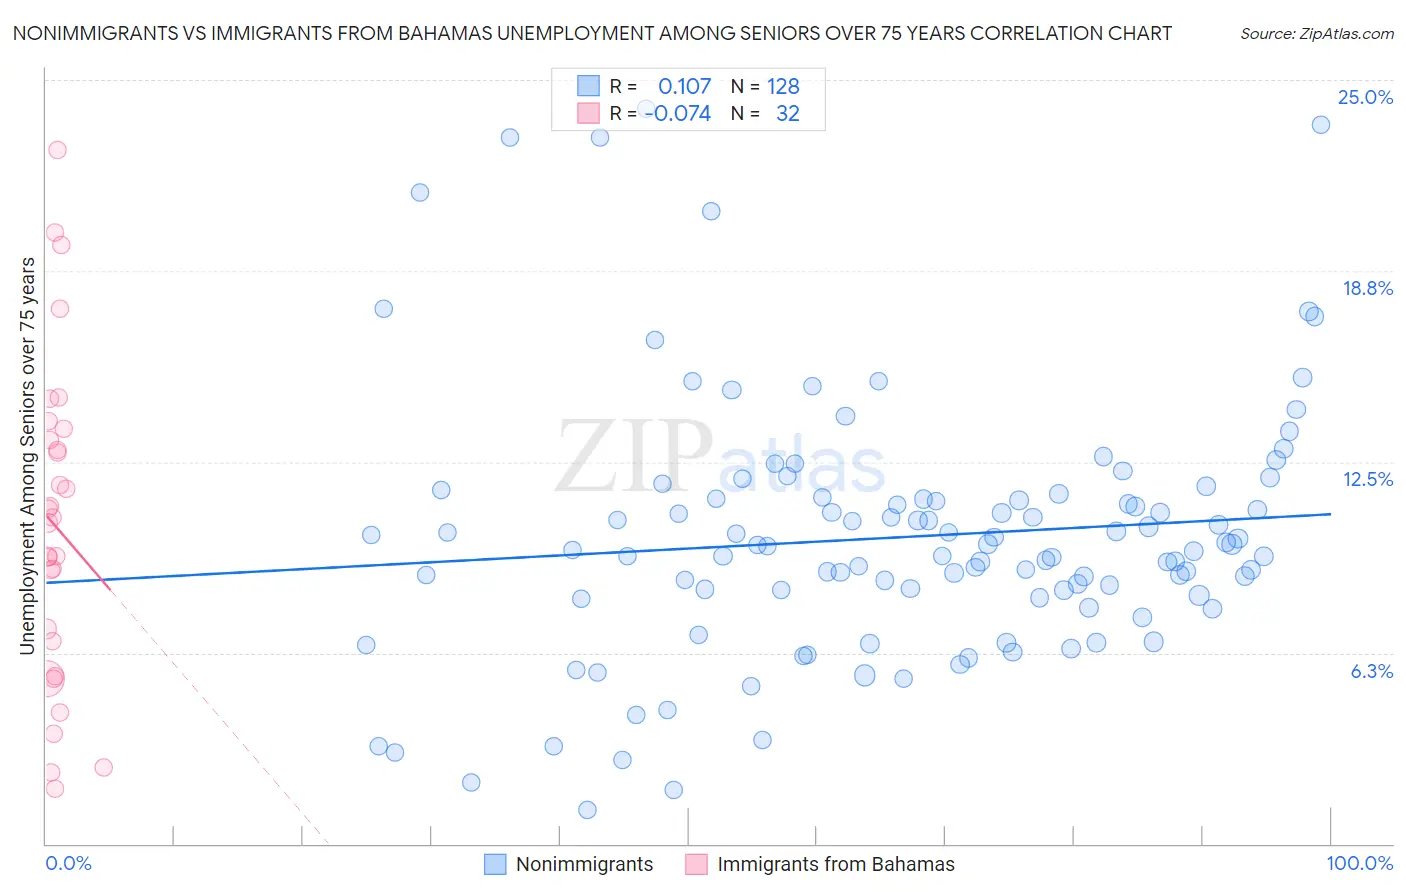
The statistical analysis conducted on geographies consisting of 234,788,716 people shows a poor positive correlation between the proportion of Nonimmigrants and unemployment rate among seniors over the age of 75 in the United States with a correlation coefficient (R) of 0.107 and weighted average of 9.8%. Similarly, the statistical analysis conducted on geographies consisting of 77,798,406 people shows a slight negative correlation between the proportion of Immigrants from Bahamas and unemployment rate among seniors over the age of 75 in the United States with a correlation coefficient (R) of -0.074 and weighted average of 8.6%, a difference of 14.2%.
Nonimmigrants vs Immigrants from Bahamas Unemployment Among Seniors over 75 years

Unemployment Among Seniors over 75 years Correlation Summary

MeasurementNonimmigrantsImmigrants from Bahamas
Minimum1.1%1.8%
Maximum24.1%22.7%
Range23.0%20.9%
Mean10.0%10.4%
Median9.7%10.6%
Interquartile 25% (IQ1)8.1%6.1%
Interquartile 75% (IQ3)11.3%13.4%
Interquartile Range (IQR)3.2%7.3%
Standard Deviation (Sample)4.2%5.2%
Standard Deviation (Population)4.2%5.2%

Similar Demographics by Unemployment Among Seniors over 75 years

Demographics Similar to Nonimmigrants by Unemployment Among Seniors over 75 years

In terms of unemployment among seniors over 75 years, the demographic groups most similar to Nonimmigrants are Immigrants from St. Vincent and the Grenadines (9.8%, a difference of 0.050%), Cherokee (9.8%, a difference of 0.13%), Immigrants from Dominica (9.8%, a difference of 0.36%), Norwegian (9.8%, a difference of 0.42%), and Lithuanian (9.9%, a difference of 0.51%).
DemographicsRating | RankUnemployment Among Seniors over 75 years
Canadians
0.0
/100
|
#288
Tragic
9.7%
Czechs
0.0
/100
|
#289
Tragic
9.7%
Sioux
0.0
/100
|
#290
Tragic
9.7%
Scandinavians
0.0
/100
|
#291
Tragic
9.7%
Immigrants | Western Africa
0.0
/100
|
#292
Tragic
9.8%
Norwegians
0.0
/100
|
#293
Tragic
9.8%
Immigrants | Dominica
0.0
/100
|
#294
Tragic
9.8%
Immigrants | Nonimmigrants
0.0
/100
|
#295
Tragic
9.8%
Immigrants | St. Vincent and the Grenadines
0.0
/100
|
#296
Tragic
9.8%
Cherokee
0.0
/100
|
#297
Tragic
9.8%
Lithuanians
0.0
/100
|
#298
Tragic
9.9%
Belgians
0.0
/100
|
#299
Tragic
9.9%
Iraqis
0.0
/100
|
#300
Tragic
9.9%
Welsh
0.0
/100
|
#301
Tragic
10.0%
Finns
0.0
/100
|
#302
Tragic
10.0%

Demographics Similar to Immigrants from Bahamas by Unemployment Among Seniors over 75 years

In terms of unemployment among seniors over 75 years, the demographic groups most similar to Immigrants from Bahamas are Turkish (8.6%, a difference of 0.010%), Ethiopian (8.6%, a difference of 0.090%), Shoshone (8.6%, a difference of 0.14%), Ecuadorian (8.6%, a difference of 0.16%), and Immigrants from Pakistan (8.6%, a difference of 0.26%).
DemographicsRating | RankUnemployment Among Seniors over 75 years
Immigrants | Ecuador
84.6
/100
|
#149
Excellent
8.5%
Paiute
82.5
/100
|
#150
Excellent
8.6%
Immigrants | Bosnia and Herzegovina
80.6
/100
|
#151
Excellent
8.6%
Latvians
80.5
/100
|
#152
Excellent
8.6%
Mongolians
80.1
/100
|
#153
Excellent
8.6%
Immigrants | Pakistan
79.7
/100
|
#154
Good
8.6%
Ecuadorians
78.5
/100
|
#155
Good
8.6%
Immigrants | Bahamas
76.5
/100
|
#156
Good
8.6%
Turks
76.4
/100
|
#157
Good
8.6%
Ethiopians
75.3
/100
|
#158
Good
8.6%
Shoshone
74.6
/100
|
#159
Good
8.6%
Cree
72.8
/100
|
#160
Good
8.6%
Albanians
72.8
/100
|
#161
Good
8.6%
Immigrants | South America
71.3
/100
|
#162
Good
8.6%
Immigrants | Guatemala
68.4
/100
|
#163
Good
8.7%