Nigerian vs Immigrants from Bolivia Householder Income Ages 45 - 64 years
COMPARE
Nigerian
Immigrants from Bolivia
Householder Income Ages 45 - 64 years
Householder Income Ages 45 - 64 years Comparison
Nigerians
Immigrants from Bolivia
$95,492
HOUSEHOLDER INCOME AGES 45 - 64 YEARS
8.2/ 100
METRIC RATING
215th/ 347
METRIC RANK
$117,731
HOUSEHOLDER INCOME AGES 45 - 64 YEARS
100.0/ 100
METRIC RATING
30th/ 347
METRIC RANK
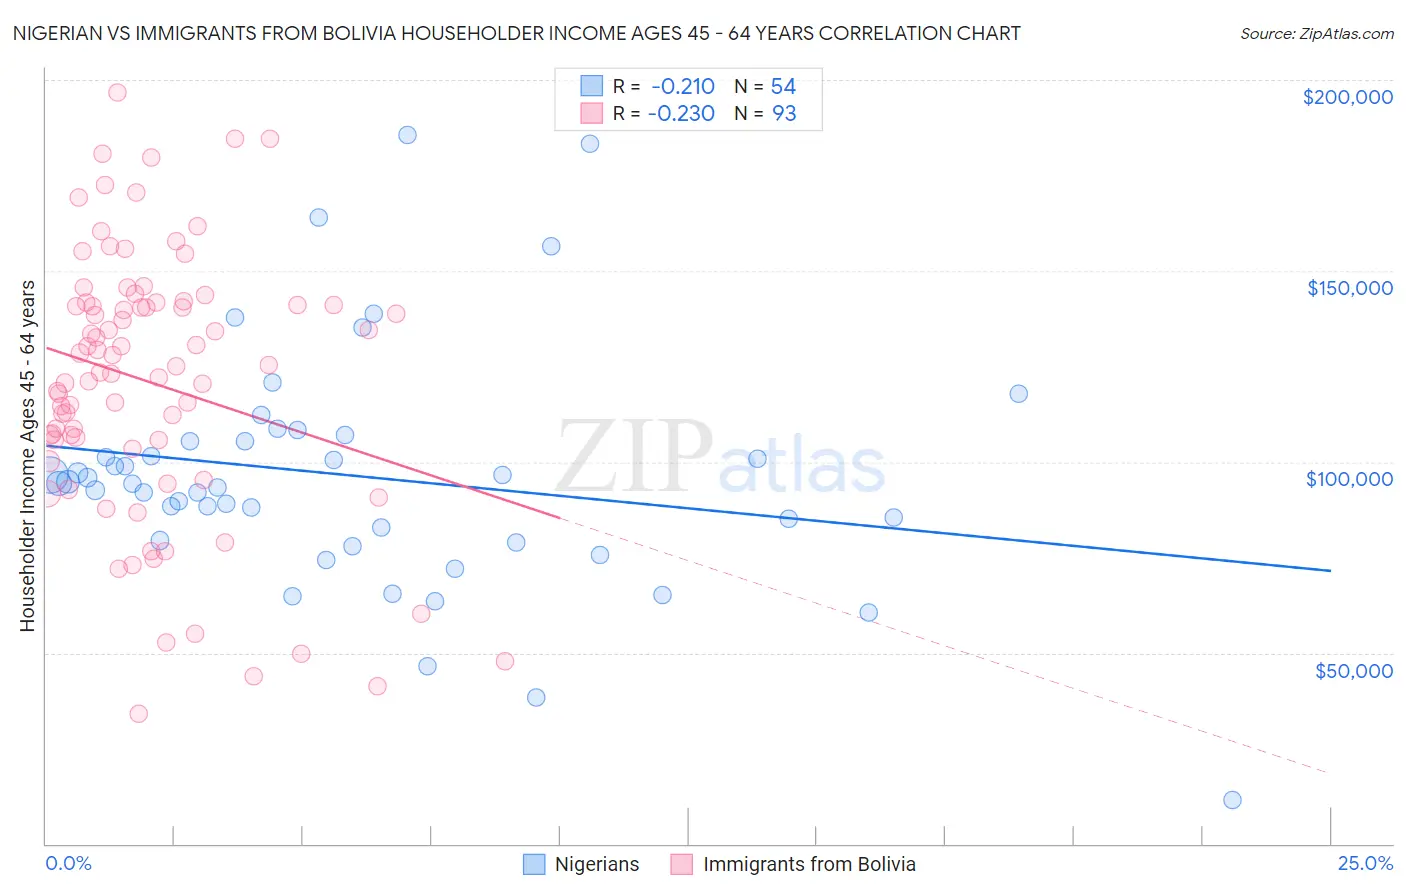
Nigerian vs Immigrants from Bolivia Householder Income Ages 45 - 64 years Correlation Chart
The statistical analysis conducted on geographies consisting of 332,111,540 people shows a weak negative correlation between the proportion of Nigerians and household income with householder between the ages 45 and 64 in the United States with a correlation coefficient (R) of -0.210 and weighted average of $95,492. Similarly, the statistical analysis conducted on geographies consisting of 158,694,143 people shows a weak negative correlation between the proportion of Immigrants from Bolivia and household income with householder between the ages 45 and 64 in the United States with a correlation coefficient (R) of -0.230 and weighted average of $117,731, a difference of 23.3%.
Householder Income Ages 45 - 64 years Correlation Summary
| Measurement | Nigerian | Immigrants from Bolivia |
| Minimum | $11,458 | $33,906 |
| Maximum | $185,761 | $196,601 |
| Range | $174,303 | $162,695 |
| Mean | $96,275 | $120,740 |
| Median | $94,283 | $124,893 |
| Interquartile 25% (IQ1) | $79,390 | $104,523 |
| Interquartile 75% (IQ3) | $105,427 | $141,314 |
| Interquartile Range (IQR) | $26,037 | $36,791 |
| Standard Deviation (Sample) | $31,417 | $34,819 |
| Standard Deviation (Population) | $31,125 | $34,631 |
Similar Demographics by Householder Income Ages 45 - 64 years
Demographics Similar to Nigerians by Householder Income Ages 45 - 64 years
In terms of householder income ages 45 - 64 years, the demographic groups most similar to Nigerians are Immigrants from Venezuela ($95,342, a difference of 0.16%), Immigrants from Ghana ($94,982, a difference of 0.54%), Panamanian ($96,066, a difference of 0.60%), Delaware ($94,914, a difference of 0.61%), and Immigrants from Uruguay ($96,086, a difference of 0.62%).
| Demographics | Rating | Rank | Householder Income Ages 45 - 64 years |
| Scotch-Irish | 16.4 /100 | #208 | Poor $97,073 |
| Japanese | 14.8 /100 | #209 | Poor $96,834 |
| Tsimshian | 14.5 /100 | #210 | Poor $96,783 |
| Immigrants | Cambodia | 13.0 /100 | #211 | Poor $96,537 |
| Venezuelans | 12.6 /100 | #212 | Poor $96,460 |
| Immigrants | Uruguay | 10.7 /100 | #213 | Poor $96,086 |
| Panamanians | 10.6 /100 | #214 | Poor $96,066 |
| Nigerians | 8.2 /100 | #215 | Tragic $95,492 |
| Immigrants | Venezuela | 7.6 /100 | #216 | Tragic $95,342 |
| Immigrants | Ghana | 6.4 /100 | #217 | Tragic $94,982 |
| Delaware | 6.2 /100 | #218 | Tragic $94,914 |
| Immigrants | Armenia | 6.1 /100 | #219 | Tragic $94,863 |
| Salvadorans | 6.0 /100 | #220 | Tragic $94,842 |
| Immigrants | Nigeria | 5.9 /100 | #221 | Tragic $94,804 |
| Malaysians | 5.2 /100 | #222 | Tragic $94,517 |
Demographics Similar to Immigrants from Bolivia by Householder Income Ages 45 - 64 years
In terms of householder income ages 45 - 64 years, the demographic groups most similar to Immigrants from Bolivia are Bhutanese ($117,750, a difference of 0.020%), Turkish ($117,814, a difference of 0.070%), Immigrants from Northern Europe ($117,930, a difference of 0.17%), Immigrants from Sweden ($118,318, a difference of 0.50%), and Asian ($118,426, a difference of 0.59%).
| Demographics | Rating | Rank | Householder Income Ages 45 - 64 years |
| Bolivians | 100.0 /100 | #23 | Exceptional $118,871 |
| Immigrants | Japan | 100.0 /100 | #24 | Exceptional $118,498 |
| Asians | 100.0 /100 | #25 | Exceptional $118,426 |
| Immigrants | Sweden | 100.0 /100 | #26 | Exceptional $118,318 |
| Immigrants | Northern Europe | 100.0 /100 | #27 | Exceptional $117,930 |
| Turks | 100.0 /100 | #28 | Exceptional $117,814 |
| Bhutanese | 100.0 /100 | #29 | Exceptional $117,750 |
| Immigrants | Bolivia | 100.0 /100 | #30 | Exceptional $117,731 |
| Immigrants | Asia | 100.0 /100 | #31 | Exceptional $116,566 |
| Russians | 100.0 /100 | #32 | Exceptional $116,328 |
| Chinese | 100.0 /100 | #33 | Exceptional $116,156 |
| Immigrants | Denmark | 100.0 /100 | #34 | Exceptional $116,000 |
| Latvians | 100.0 /100 | #35 | Exceptional $115,957 |
| Immigrants | Switzerland | 100.0 /100 | #36 | Exceptional $115,934 |
| Maltese | 99.9 /100 | #37 | Exceptional $114,754 |