South African vs Immigrants from Central America Householder Income Under 25 years
COMPARE
South African
Immigrants from Central America
Householder Income Under 25 years
Householder Income Under 25 years Comparison
South Africans
Immigrants from Central America
$51,383
HOUSEHOLDER INCOME UNDER 25 YEARS
12.2/ 100
METRIC RATING
207th/ 347
METRIC RANK
$51,022
HOUSEHOLDER INCOME UNDER 25 YEARS
5.4/ 100
METRIC RATING
227th/ 347
METRIC RANK
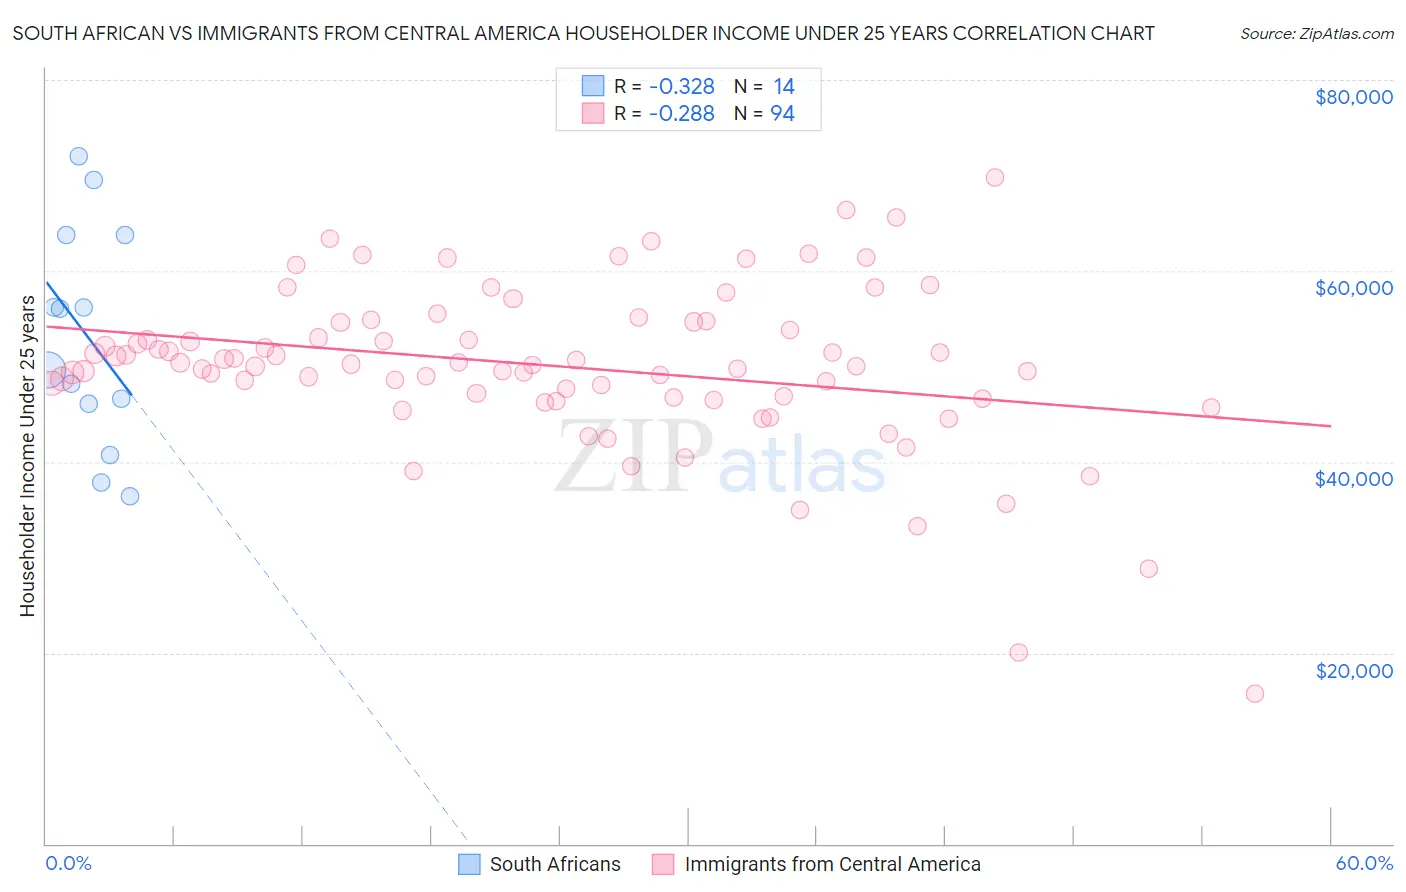
South African vs Immigrants from Central America Householder Income Under 25 years Correlation Chart
The statistical analysis conducted on geographies consisting of 162,551,687 people shows a mild negative correlation between the proportion of South Africans and household income with householder under the age of 25 in the United States with a correlation coefficient (R) of -0.328 and weighted average of $51,383. Similarly, the statistical analysis conducted on geographies consisting of 425,295,925 people shows a weak negative correlation between the proportion of Immigrants from Central America and household income with householder under the age of 25 in the United States with a correlation coefficient (R) of -0.288 and weighted average of $51,022, a difference of 0.71%.
Householder Income Under 25 years Correlation Summary
| Measurement | South African | Immigrants from Central America |
| Minimum | $36,406 | $15,750 |
| Maximum | $72,020 | $69,727 |
| Range | $35,614 | $53,977 |
| Mean | $53,067 | $50,026 |
| Median | $52,781 | $50,176 |
| Interquartile 25% (IQ1) | $46,113 | $46,703 |
| Interquartile 75% (IQ3) | $63,791 | $54,624 |
| Interquartile Range (IQR) | $17,678 | $7,920 |
| Standard Deviation (Sample) | $11,360 | $8,635 |
| Standard Deviation (Population) | $10,947 | $8,589 |
Demographics Similar to South Africans and Immigrants from Central America by Householder Income Under 25 years
In terms of householder income under 25 years, the demographic groups most similar to South Africans are Immigrants from Jordan ($51,370, a difference of 0.020%), Syrian ($51,353, a difference of 0.060%), Immigrants from Ghana ($51,333, a difference of 0.10%), Irish ($51,317, a difference of 0.13%), and Immigrants from Panama ($51,278, a difference of 0.20%). Similarly, the demographic groups most similar to Immigrants from Central America are Yugoslavian ($51,028, a difference of 0.010%), Immigrants from Jamaica ($51,038, a difference of 0.030%), Belizean ($51,094, a difference of 0.14%), Serbian ($51,106, a difference of 0.16%), and Spaniard ($51,117, a difference of 0.19%).
| Demographics | Rating | Rank | Householder Income Under 25 years |
| South Africans | 12.2 /100 | #207 | Poor $51,383 |
| Immigrants | Jordan | 11.9 /100 | #208 | Poor $51,370 |
| Syrians | 11.4 /100 | #209 | Poor $51,353 |
| Immigrants | Ghana | 10.9 /100 | #210 | Poor $51,333 |
| Irish | 10.6 /100 | #211 | Poor $51,317 |
| Immigrants | Panama | 9.7 /100 | #212 | Tragic $51,278 |
| Dutch | 9.4 /100 | #213 | Tragic $51,265 |
| Zimbabweans | 9.3 /100 | #214 | Tragic $51,259 |
| Icelanders | 9.1 /100 | #215 | Tragic $51,247 |
| French | 8.7 /100 | #216 | Tragic $51,230 |
| Czechoslovakians | 8.6 /100 | #217 | Tragic $51,224 |
| Immigrants | Belize | 8.6 /100 | #218 | Tragic $51,223 |
| Arabs | 8.5 /100 | #219 | Tragic $51,219 |
| Immigrants | Germany | 8.0 /100 | #220 | Tragic $51,190 |
| Immigrants | Eastern Africa | 7.4 /100 | #221 | Tragic $51,158 |
| Spaniards | 6.8 /100 | #222 | Tragic $51,117 |
| Serbians | 6.6 /100 | #223 | Tragic $51,106 |
| Belizeans | 6.4 /100 | #224 | Tragic $51,094 |
| Immigrants | Jamaica | 5.6 /100 | #225 | Tragic $51,038 |
| Yugoslavians | 5.5 /100 | #226 | Tragic $51,028 |
| Immigrants | Central America | 5.4 /100 | #227 | Tragic $51,022 |