Malaysian vs Immigrants from Laos Median Household Income
COMPARE
Malaysian
Immigrants from Laos
Median Household Income
Median Household Income Comparison
Malaysians
Immigrants from Laos
$81,064
MEDIAN HOUSEHOLD INCOME
7.0/ 100
METRIC RATING
224th/ 347
METRIC RANK
$78,327
MEDIAN HOUSEHOLD INCOME
1.3/ 100
METRIC RATING
250th/ 347
METRIC RANK
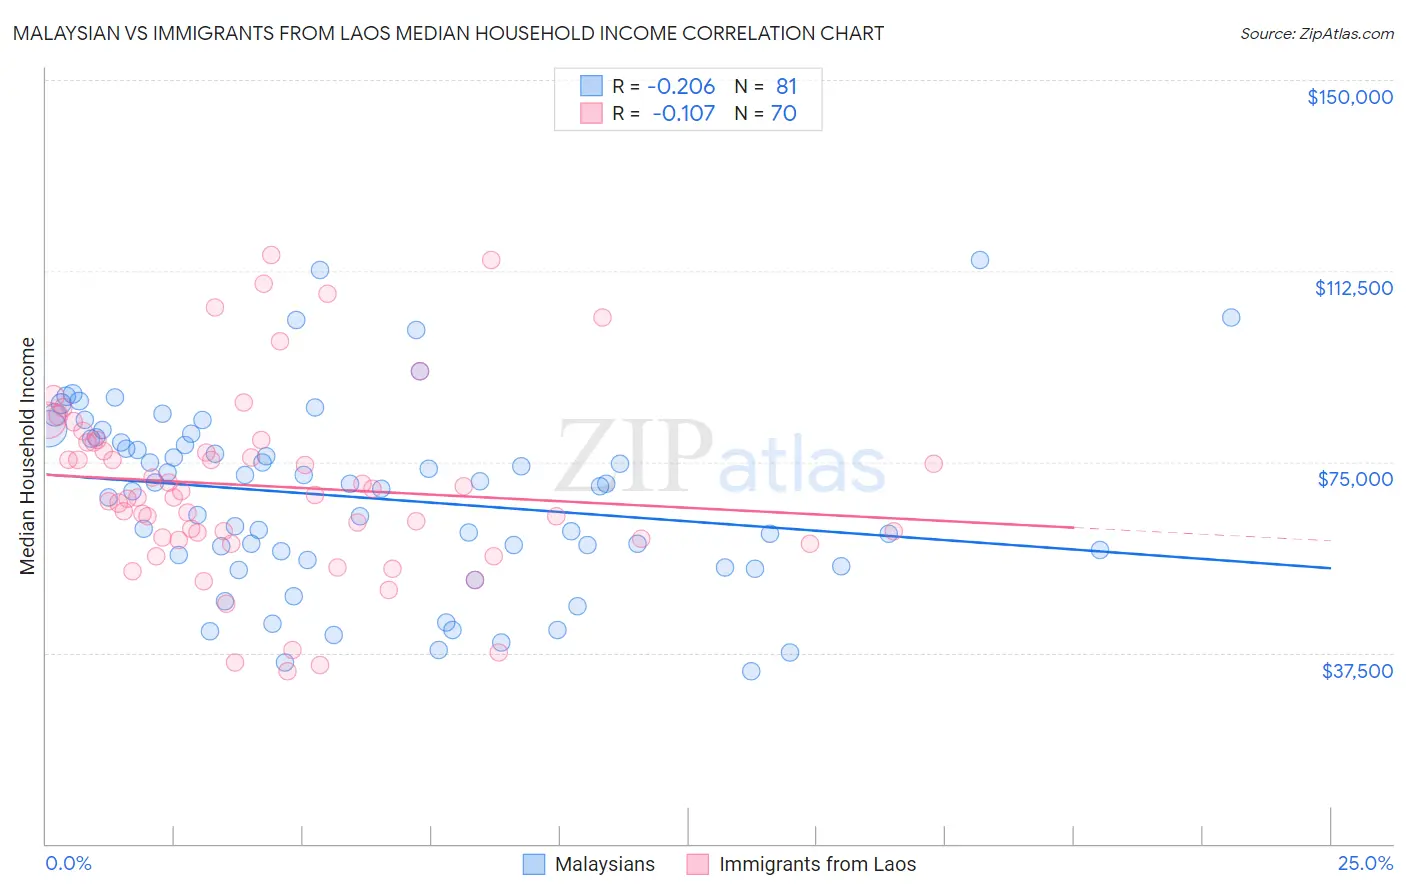
Malaysian vs Immigrants from Laos Median Household Income Correlation Chart
The statistical analysis conducted on geographies consisting of 225,962,750 people shows a weak negative correlation between the proportion of Malaysians and median household income in the United States with a correlation coefficient (R) of -0.206 and weighted average of $81,064. Similarly, the statistical analysis conducted on geographies consisting of 201,460,424 people shows a poor negative correlation between the proportion of Immigrants from Laos and median household income in the United States with a correlation coefficient (R) of -0.107 and weighted average of $78,327, a difference of 3.5%.
Median Household Income Correlation Summary
| Measurement | Malaysian | Immigrants from Laos |
| Minimum | $33,804 | $33,804 |
| Maximum | $114,680 | $115,579 |
| Range | $80,876 | $81,775 |
| Mean | $68,008 | $70,206 |
| Median | $70,094 | $68,245 |
| Interquartile 25% (IQ1) | $56,150 | $59,790 |
| Interquartile 75% (IQ3) | $79,730 | $78,877 |
| Interquartile Range (IQR) | $23,581 | $19,087 |
| Standard Deviation (Sample) | $17,902 | $18,088 |
| Standard Deviation (Population) | $17,791 | $17,959 |
Similar Demographics by Median Household Income
Demographics Similar to Malaysians by Median Household Income
In terms of median household income, the demographic groups most similar to Malaysians are Scotch-Irish ($80,972, a difference of 0.11%), Immigrants from El Salvador ($81,213, a difference of 0.18%), Immigrants from Nigeria ($81,236, a difference of 0.21%), Immigrants from Panama ($80,873, a difference of 0.24%), and Guyanese ($80,734, a difference of 0.41%).
| Demographics | Rating | Rank | Median Household Income |
| Ecuadorians | 12.5 /100 | #217 | Poor $82,070 |
| Whites/Caucasians | 12.2 /100 | #218 | Poor $82,029 |
| Nigerians | 10.3 /100 | #219 | Poor $81,725 |
| Immigrants | Venezuela | 9.0 /100 | #220 | Tragic $81,506 |
| Immigrants | Ghana | 9.0 /100 | #221 | Tragic $81,489 |
| Immigrants | Nigeria | 7.7 /100 | #222 | Tragic $81,236 |
| Immigrants | El Salvador | 7.6 /100 | #223 | Tragic $81,213 |
| Malaysians | 7.0 /100 | #224 | Tragic $81,064 |
| Scotch-Irish | 6.6 /100 | #225 | Tragic $80,972 |
| Immigrants | Panama | 6.2 /100 | #226 | Tragic $80,873 |
| Guyanese | 5.7 /100 | #227 | Tragic $80,734 |
| Immigrants | Bangladesh | 5.7 /100 | #228 | Tragic $80,722 |
| Delaware | 5.0 /100 | #229 | Tragic $80,527 |
| Bermudans | 4.7 /100 | #230 | Tragic $80,406 |
| Trinidadians and Tobagonians | 4.7 /100 | #231 | Tragic $80,402 |
Demographics Similar to Immigrants from Laos by Median Household Income
In terms of median household income, the demographic groups most similar to Immigrants from Laos are West Indian ($78,455, a difference of 0.16%), Mexican American Indian ($78,166, a difference of 0.21%), Sudanese ($78,529, a difference of 0.26%), Immigrants from Burma/Myanmar ($78,682, a difference of 0.45%), and Immigrants from West Indies ($77,956, a difference of 0.48%).
| Demographics | Rating | Rank | Median Household Income |
| Immigrants | Barbados | 1.9 /100 | #243 | Tragic $78,989 |
| Marshallese | 1.9 /100 | #244 | Tragic $78,930 |
| Inupiat | 1.8 /100 | #245 | Tragic $78,841 |
| Central Americans | 1.7 /100 | #246 | Tragic $78,803 |
| Immigrants | Burma/Myanmar | 1.6 /100 | #247 | Tragic $78,682 |
| Sudanese | 1.5 /100 | #248 | Tragic $78,529 |
| West Indians | 1.4 /100 | #249 | Tragic $78,455 |
| Immigrants | Laos | 1.3 /100 | #250 | Tragic $78,327 |
| Mexican American Indians | 1.2 /100 | #251 | Tragic $78,166 |
| Immigrants | West Indies | 1.0 /100 | #252 | Tragic $77,956 |
| Immigrants | St. Vincent and the Grenadines | 0.9 /100 | #253 | Tragic $77,690 |
| Sub-Saharan Africans | 0.8 /100 | #254 | Tragic $77,631 |
| Immigrants | Middle Africa | 0.8 /100 | #255 | Tragic $77,559 |
| Belizeans | 0.6 /100 | #256 | Tragic $77,028 |
| Immigrants | Senegal | 0.5 /100 | #257 | Tragic $76,915 |