Cape Verdean vs Immigrants from Laos Median Household Income
COMPARE
Cape Verdean
Immigrants from Laos
Median Household Income
Median Household Income Comparison
Cape Verdeans
Immigrants from Laos
$75,848
MEDIAN HOUSEHOLD INCOME
0.3/ 100
METRIC RATING
269th/ 347
METRIC RANK
$78,327
MEDIAN HOUSEHOLD INCOME
1.3/ 100
METRIC RATING
250th/ 347
METRIC RANK
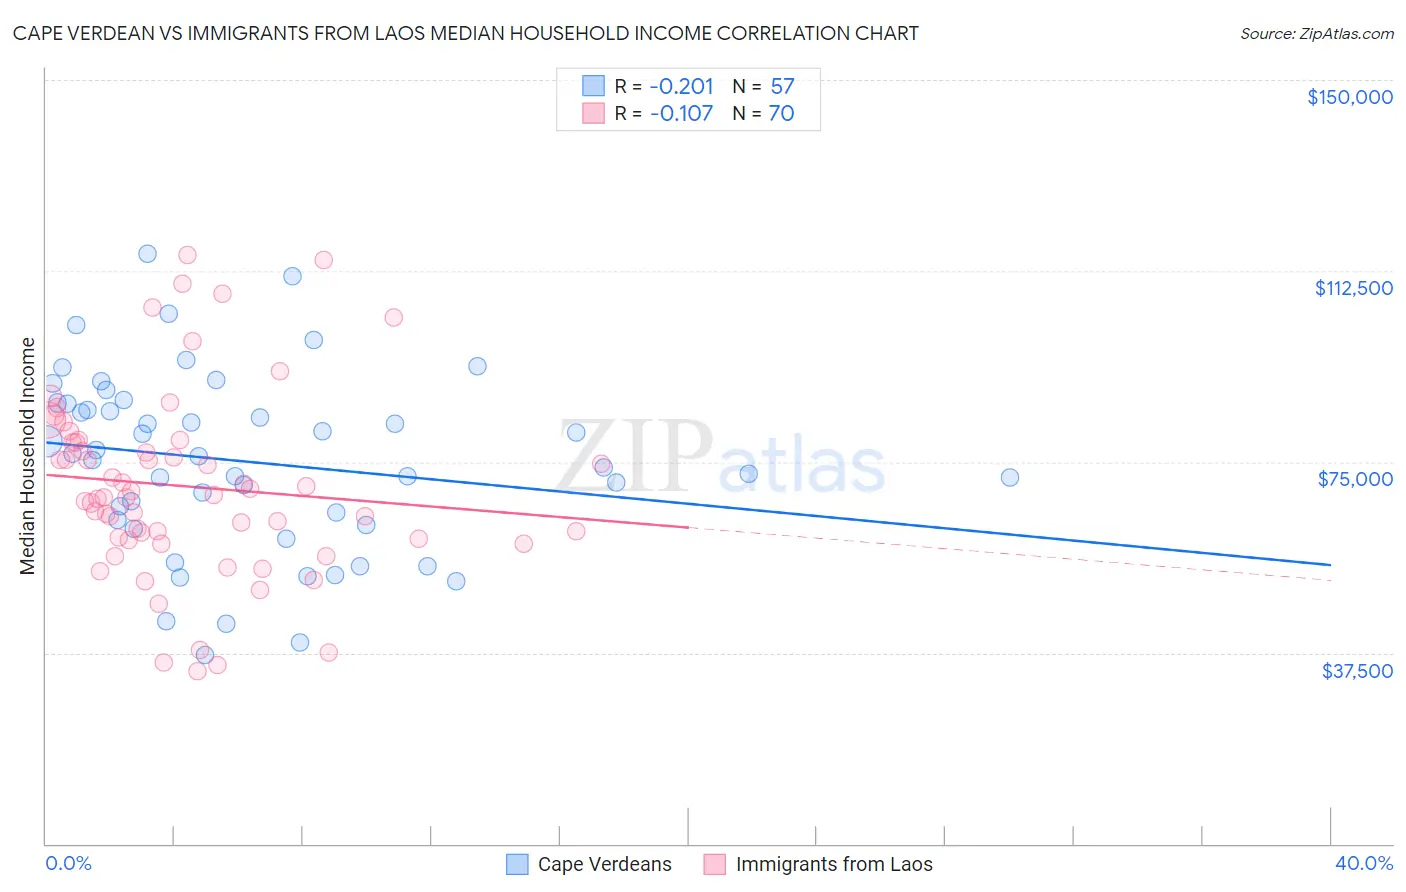
Cape Verdean vs Immigrants from Laos Median Household Income Correlation Chart
The statistical analysis conducted on geographies consisting of 107,534,548 people shows a weak negative correlation between the proportion of Cape Verdeans and median household income in the United States with a correlation coefficient (R) of -0.201 and weighted average of $75,848. Similarly, the statistical analysis conducted on geographies consisting of 201,460,424 people shows a poor negative correlation between the proportion of Immigrants from Laos and median household income in the United States with a correlation coefficient (R) of -0.107 and weighted average of $78,327, a difference of 3.3%.
Median Household Income Correlation Summary
| Measurement | Cape Verdean | Immigrants from Laos |
| Minimum | $37,158 | $33,804 |
| Maximum | $115,791 | $115,579 |
| Range | $78,633 | $81,775 |
| Mean | $75,036 | $70,206 |
| Median | $76,048 | $68,245 |
| Interquartile 25% (IQ1) | $63,051 | $59,790 |
| Interquartile 75% (IQ3) | $86,492 | $78,877 |
| Interquartile Range (IQR) | $23,441 | $19,087 |
| Standard Deviation (Sample) | $17,562 | $18,088 |
| Standard Deviation (Population) | $17,408 | $17,959 |
Demographics Similar to Cape Verdeans and Immigrants from Laos by Median Household Income
In terms of median household income, the demographic groups most similar to Cape Verdeans are Immigrants from Jamaica ($75,851, a difference of 0.0%), German Russian ($75,856, a difference of 0.010%), American ($75,932, a difference of 0.11%), Immigrants from Belize ($75,938, a difference of 0.12%), and Guatemalan ($75,961, a difference of 0.15%). Similarly, the demographic groups most similar to Immigrants from Laos are West Indian ($78,455, a difference of 0.16%), Mexican American Indian ($78,166, a difference of 0.21%), Immigrants from West Indies ($77,956, a difference of 0.48%), Immigrants from St. Vincent and the Grenadines ($77,690, a difference of 0.82%), and Subsaharan African ($77,631, a difference of 0.90%).
| Demographics | Rating | Rank | Median Household Income |
| West Indians | 1.4 /100 | #249 | Tragic $78,455 |
| Immigrants | Laos | 1.3 /100 | #250 | Tragic $78,327 |
| Mexican American Indians | 1.2 /100 | #251 | Tragic $78,166 |
| Immigrants | West Indies | 1.0 /100 | #252 | Tragic $77,956 |
| Immigrants | St. Vincent and the Grenadines | 0.9 /100 | #253 | Tragic $77,690 |
| Sub-Saharan Africans | 0.8 /100 | #254 | Tragic $77,631 |
| Immigrants | Middle Africa | 0.8 /100 | #255 | Tragic $77,559 |
| Belizeans | 0.6 /100 | #256 | Tragic $77,028 |
| Immigrants | Senegal | 0.5 /100 | #257 | Tragic $76,915 |
| Immigrants | Nicaragua | 0.5 /100 | #258 | Tragic $76,784 |
| Spanish American Indians | 0.4 /100 | #259 | Tragic $76,670 |
| Jamaicans | 0.4 /100 | #260 | Tragic $76,583 |
| Immigrants | Grenada | 0.4 /100 | #261 | Tragic $76,517 |
| French American Indians | 0.4 /100 | #262 | Tragic $76,387 |
| Alaskan Athabascans | 0.4 /100 | #263 | Tragic $76,383 |
| Guatemalans | 0.3 /100 | #264 | Tragic $75,961 |
| Immigrants | Belize | 0.3 /100 | #265 | Tragic $75,938 |
| Americans | 0.3 /100 | #266 | Tragic $75,932 |
| German Russians | 0.3 /100 | #267 | Tragic $75,856 |
| Immigrants | Jamaica | 0.3 /100 | #268 | Tragic $75,851 |
| Cape Verdeans | 0.3 /100 | #269 | Tragic $75,848 |