Luxembourger vs Immigrants from Jordan Median Male Earnings
COMPARE
Luxembourger
Immigrants from Jordan
Median Male Earnings
Median Male Earnings Comparison
Luxembourgers
Immigrants from Jordan
$56,300
MEDIAN MALE EARNINGS
85.5/ 100
METRIC RATING
140th/ 347
METRIC RANK
$57,145
MEDIAN MALE EARNINGS
93.1/ 100
METRIC RATING
122nd/ 347
METRIC RANK
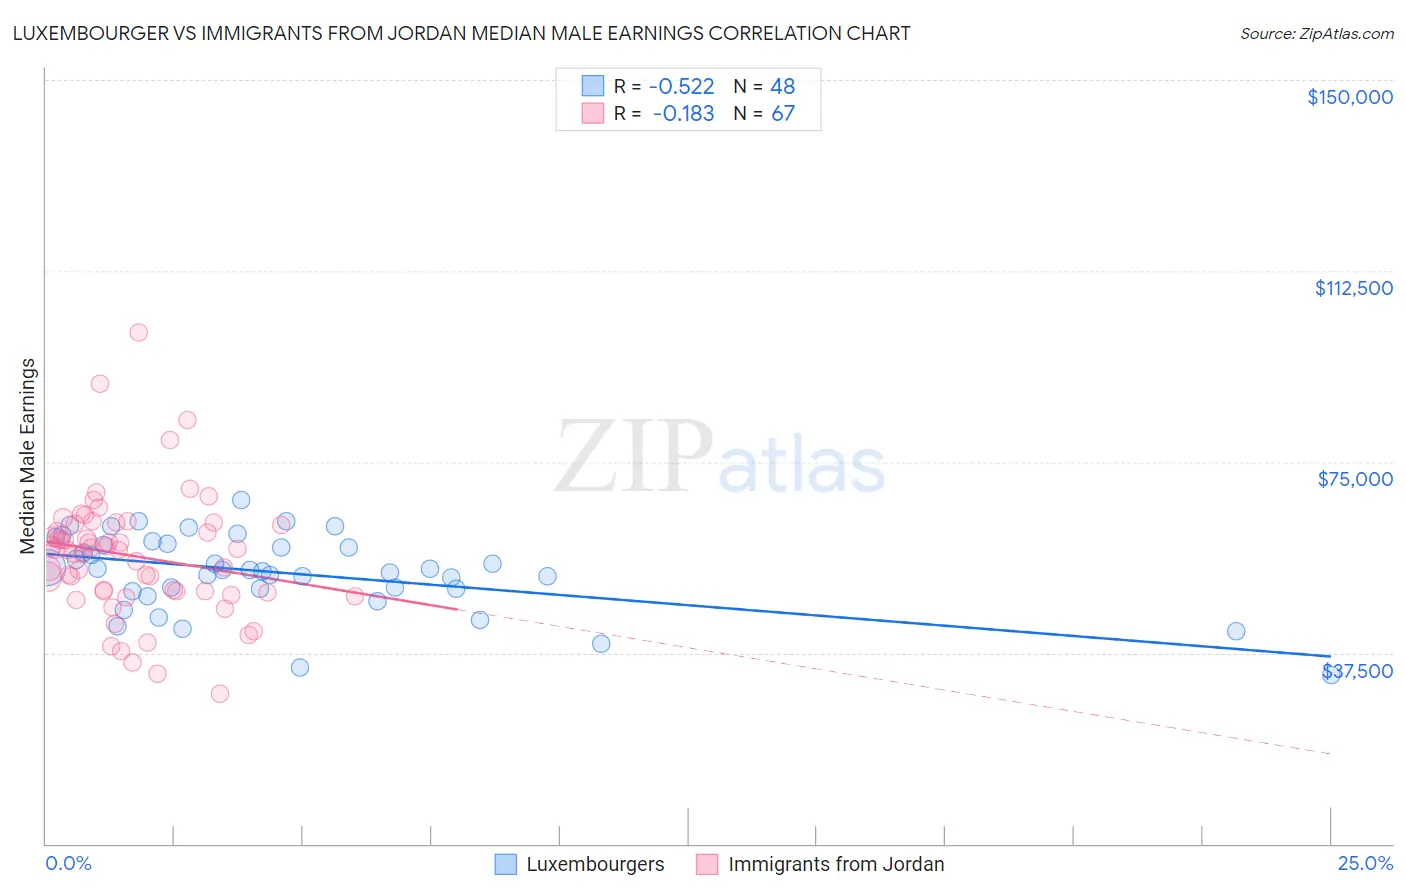
Luxembourger vs Immigrants from Jordan Median Male Earnings Correlation Chart
The statistical analysis conducted on geographies consisting of 144,673,100 people shows a substantial negative correlation between the proportion of Luxembourgers and median male earnings in the United States with a correlation coefficient (R) of -0.522 and weighted average of $56,300. Similarly, the statistical analysis conducted on geographies consisting of 181,244,251 people shows a poor negative correlation between the proportion of Immigrants from Jordan and median male earnings in the United States with a correlation coefficient (R) of -0.183 and weighted average of $57,145, a difference of 1.5%.
Median Male Earnings Correlation Summary
| Measurement | Luxembourger | Immigrants from Jordan |
| Minimum | $33,125 | $29,414 |
| Maximum | $67,500 | $100,501 |
| Range | $34,375 | $71,087 |
| Mean | $53,182 | $56,566 |
| Median | $53,767 | $57,678 |
| Interquartile 25% (IQ1) | $49,758 | $49,640 |
| Interquartile 75% (IQ3) | $58,691 | $62,778 |
| Interquartile Range (IQR) | $8,933 | $13,138 |
| Standard Deviation (Sample) | $7,604 | $12,126 |
| Standard Deviation (Population) | $7,525 | $12,035 |
Demographics Similar to Luxembourgers and Immigrants from Jordan by Median Male Earnings
In terms of median male earnings, the demographic groups most similar to Luxembourgers are Zimbabwean ($56,302, a difference of 0.0%), Slovak ($56,306, a difference of 0.010%), Danish ($56,246, a difference of 0.10%), Slavic ($56,390, a difference of 0.16%), and Immigrants from Saudi Arabia ($56,452, a difference of 0.27%). Similarly, the demographic groups most similar to Immigrants from Jordan are Slovene ($57,145, a difference of 0.0%), Immigrants from Albania ($57,179, a difference of 0.060%), Chilean ($56,973, a difference of 0.30%), Immigrants from Morocco ($56,958, a difference of 0.33%), and Chinese ($56,872, a difference of 0.48%).
| Demographics | Rating | Rank | Median Male Earnings |
| Immigrants | Albania | 93.3 /100 | #121 | Exceptional $57,179 |
| Immigrants | Jordan | 93.1 /100 | #122 | Exceptional $57,145 |
| Slovenes | 93.1 /100 | #123 | Exceptional $57,145 |
| Chileans | 91.9 /100 | #124 | Exceptional $56,973 |
| Immigrants | Morocco | 91.8 /100 | #125 | Exceptional $56,958 |
| Chinese | 91.1 /100 | #126 | Exceptional $56,872 |
| Brazilians | 90.9 /100 | #127 | Exceptional $56,837 |
| Immigrants | Syria | 90.8 /100 | #128 | Exceptional $56,830 |
| Pakistanis | 89.9 /100 | #129 | Excellent $56,719 |
| Koreans | 89.4 /100 | #130 | Excellent $56,672 |
| Portuguese | 89.4 /100 | #131 | Excellent $56,663 |
| Czechs | 88.2 /100 | #132 | Excellent $56,546 |
| Immigrants | Germany | 88.2 /100 | #133 | Excellent $56,542 |
| Moroccans | 87.7 /100 | #134 | Excellent $56,499 |
| Irish | 87.4 /100 | #135 | Excellent $56,464 |
| Immigrants | Saudi Arabia | 87.2 /100 | #136 | Excellent $56,452 |
| Slavs | 86.5 /100 | #137 | Excellent $56,390 |
| Slovaks | 85.5 /100 | #138 | Excellent $56,306 |
| Zimbabweans | 85.5 /100 | #139 | Excellent $56,302 |
| Luxembourgers | 85.5 /100 | #140 | Excellent $56,300 |
| Danes | 84.8 /100 | #141 | Excellent $56,246 |