Luxembourger vs Immigrants from Malaysia Per Capita Income
COMPARE
Luxembourger
Immigrants from Malaysia
Per Capita Income
Per Capita Income Comparison
Luxembourgers
Immigrants from Malaysia
$45,663
PER CAPITA INCOME
90.4/ 100
METRIC RATING
129th/ 347
METRIC RANK
$49,983
PER CAPITA INCOME
99.9/ 100
METRIC RATING
58th/ 347
METRIC RANK
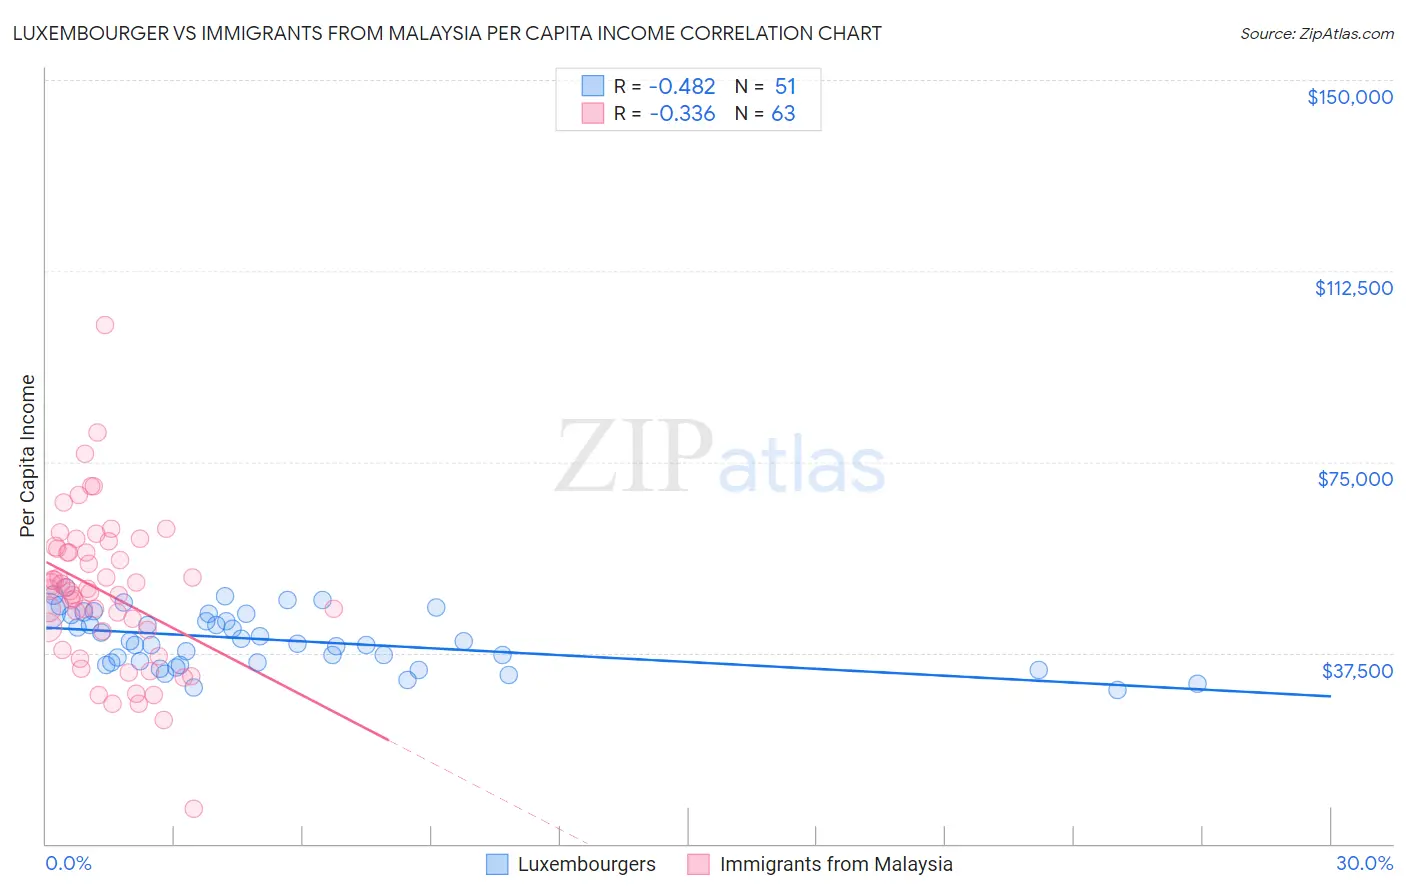
Luxembourger vs Immigrants from Malaysia Per Capita Income Correlation Chart
The statistical analysis conducted on geographies consisting of 144,682,505 people shows a moderate negative correlation between the proportion of Luxembourgers and per capita income in the United States with a correlation coefficient (R) of -0.482 and weighted average of $45,663. Similarly, the statistical analysis conducted on geographies consisting of 197,965,011 people shows a mild negative correlation between the proportion of Immigrants from Malaysia and per capita income in the United States with a correlation coefficient (R) of -0.336 and weighted average of $49,983, a difference of 9.5%.
Per Capita Income Correlation Summary
| Measurement | Luxembourger | Immigrants from Malaysia |
| Minimum | $30,080 | $6,770 |
| Maximum | $50,248 | $101,760 |
| Range | $20,168 | $94,990 |
| Mean | $40,097 | $49,426 |
| Median | $39,752 | $49,924 |
| Interquartile 25% (IQ1) | $35,555 | $41,735 |
| Interquartile 75% (IQ3) | $45,199 | $57,884 |
| Interquartile Range (IQR) | $9,644 | $16,150 |
| Standard Deviation (Sample) | $5,390 | $15,009 |
| Standard Deviation (Population) | $5,337 | $14,890 |
Similar Demographics by Per Capita Income
Demographics Similar to Luxembourgers by Per Capita Income
In terms of per capita income, the demographic groups most similar to Luxembourgers are Arab ($45,662, a difference of 0.0%), Immigrants from North Macedonia ($45,622, a difference of 0.090%), Jordanian ($45,605, a difference of 0.13%), Pakistani ($45,587, a difference of 0.17%), and Slovene ($45,581, a difference of 0.18%).
| Demographics | Rating | Rank | Per Capita Income |
| Moroccans | 92.1 /100 | #122 | Exceptional $45,854 |
| Lebanese | 92.0 /100 | #123 | Exceptional $45,840 |
| Europeans | 92.0 /100 | #124 | Exceptional $45,836 |
| Zimbabweans | 91.7 /100 | #125 | Exceptional $45,804 |
| Palestinians | 91.6 /100 | #126 | Exceptional $45,790 |
| Immigrants | Germany | 91.3 /100 | #127 | Exceptional $45,751 |
| Swedes | 91.3 /100 | #128 | Exceptional $45,750 |
| Luxembourgers | 90.4 /100 | #129 | Exceptional $45,663 |
| Arabs | 90.4 /100 | #130 | Exceptional $45,662 |
| Immigrants | North Macedonia | 90.0 /100 | #131 | Exceptional $45,622 |
| Jordanians | 89.9 /100 | #132 | Excellent $45,605 |
| Pakistanis | 89.7 /100 | #133 | Excellent $45,587 |
| Slovenes | 89.6 /100 | #134 | Excellent $45,581 |
| Hungarians | 87.9 /100 | #135 | Excellent $45,426 |
| Immigrants | Oceania | 85.2 /100 | #136 | Excellent $45,220 |
Demographics Similar to Immigrants from Malaysia by Per Capita Income
In terms of per capita income, the demographic groups most similar to Immigrants from Malaysia are South African ($50,044, a difference of 0.12%), Asian ($50,057, a difference of 0.15%), Immigrants from Western Europe ($50,065, a difference of 0.16%), Bhutanese ($49,894, a difference of 0.18%), and Immigrants from Scotland ($49,893, a difference of 0.18%).
| Demographics | Rating | Rank | Per Capita Income |
| Immigrants | Netherlands | 100.0 /100 | #51 | Exceptional $50,458 |
| Immigrants | Croatia | 99.9 /100 | #52 | Exceptional $50,417 |
| Paraguayans | 99.9 /100 | #53 | Exceptional $50,385 |
| Immigrants | Belarus | 99.9 /100 | #54 | Exceptional $50,303 |
| Immigrants | Western Europe | 99.9 /100 | #55 | Exceptional $50,065 |
| Asians | 99.9 /100 | #56 | Exceptional $50,057 |
| South Africans | 99.9 /100 | #57 | Exceptional $50,044 |
| Immigrants | Malaysia | 99.9 /100 | #58 | Exceptional $49,983 |
| Bhutanese | 99.9 /100 | #59 | Exceptional $49,894 |
| Immigrants | Scotland | 99.9 /100 | #60 | Exceptional $49,893 |
| Argentineans | 99.9 /100 | #61 | Exceptional $49,862 |
| Immigrants | Asia | 99.9 /100 | #62 | Exceptional $49,741 |
| Maltese | 99.9 /100 | #63 | Exceptional $49,640 |
| Immigrants | Argentina | 99.9 /100 | #64 | Exceptional $49,627 |
| Bolivians | 99.9 /100 | #65 | Exceptional $49,526 |