Luxembourger vs Czech Median Household Income
COMPARE
Luxembourger
Czech
Median Household Income
Median Household Income Comparison
Luxembourgers
Czechs
$86,418
MEDIAN HOUSEHOLD INCOME
70.0/ 100
METRIC RATING
160th/ 347
METRIC RANK
$86,164
MEDIAN HOUSEHOLD INCOME
66.4/ 100
METRIC RATING
163rd/ 347
METRIC RANK
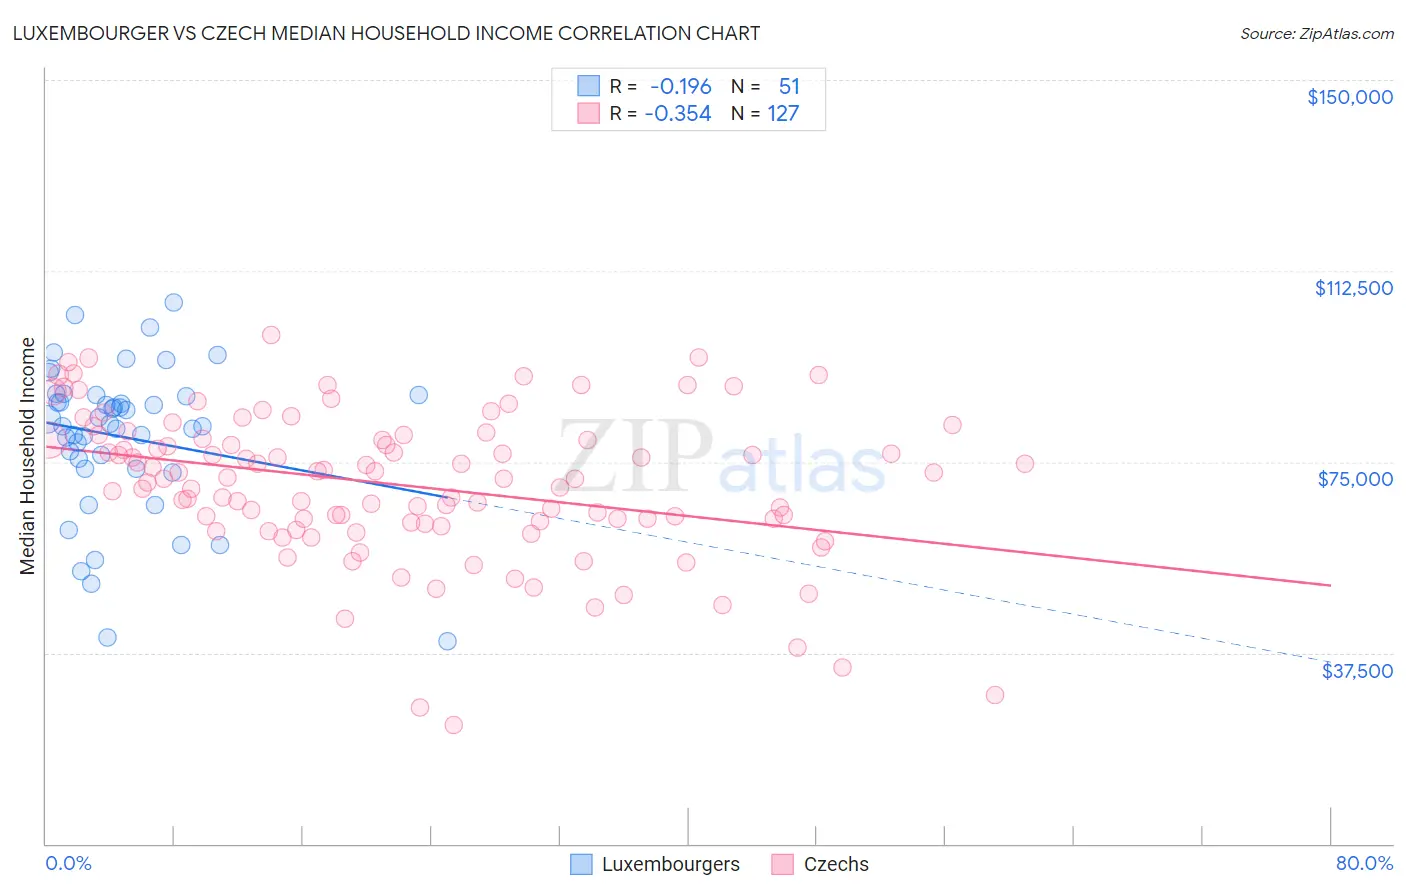
Luxembourger vs Czech Median Household Income Correlation Chart
The statistical analysis conducted on geographies consisting of 144,630,176 people shows a poor negative correlation between the proportion of Luxembourgers and median household income in the United States with a correlation coefficient (R) of -0.196 and weighted average of $86,418. Similarly, the statistical analysis conducted on geographies consisting of 484,294,688 people shows a mild negative correlation between the proportion of Czechs and median household income in the United States with a correlation coefficient (R) of -0.354 and weighted average of $86,164, a difference of 0.30%.
Median Household Income Correlation Summary
| Measurement | Luxembourger | Czech |
| Minimum | $39,750 | $23,393 |
| Maximum | $106,423 | $99,887 |
| Range | $66,673 | $76,494 |
| Mean | $79,856 | $70,465 |
| Median | $82,566 | $71,750 |
| Interquartile 25% (IQ1) | $73,750 | $63,125 |
| Interquartile 75% (IQ3) | $88,077 | $79,521 |
| Interquartile Range (IQR) | $14,327 | $16,396 |
| Standard Deviation (Sample) | $14,707 | $14,479 |
| Standard Deviation (Population) | $14,562 | $14,422 |
Demographics Similar to Luxembourgers and Czechs by Median Household Income
In terms of median household income, the demographic groups most similar to Luxembourgers are Immigrants from Uzbekistan ($86,425, a difference of 0.010%), Slavic ($86,398, a difference of 0.020%), Moroccan ($86,468, a difference of 0.060%), Samoan ($86,498, a difference of 0.090%), and Immigrants from Albania ($86,534, a difference of 0.13%). Similarly, the demographic groups most similar to Czechs are Irish ($86,145, a difference of 0.020%), Norwegian ($86,084, a difference of 0.090%), Guamanian/Chamorro ($86,255, a difference of 0.11%), Scandinavian ($86,073, a difference of 0.11%), and Slavic ($86,398, a difference of 0.27%).
| Demographics | Rating | Rank | Median Household Income |
| Hungarians | 76.3 /100 | #151 | Good $86,920 |
| Immigrants | Saudi Arabia | 75.8 /100 | #152 | Good $86,875 |
| South Americans | 75.1 /100 | #153 | Good $86,824 |
| Immigrants | Germany | 74.4 /100 | #154 | Good $86,764 |
| Carpatho Rusyns | 72.8 /100 | #155 | Good $86,635 |
| Immigrants | Albania | 71.5 /100 | #156 | Good $86,534 |
| Samoans | 71.0 /100 | #157 | Good $86,498 |
| Moroccans | 70.6 /100 | #158 | Good $86,468 |
| Immigrants | Uzbekistan | 70.1 /100 | #159 | Good $86,425 |
| Luxembourgers | 70.0 /100 | #160 | Good $86,418 |
| Slavs | 69.7 /100 | #161 | Good $86,398 |
| Guamanians/Chamorros | 67.7 /100 | #162 | Good $86,255 |
| Czechs | 66.4 /100 | #163 | Good $86,164 |
| Irish | 66.2 /100 | #164 | Good $86,145 |
| Norwegians | 65.3 /100 | #165 | Good $86,084 |
| Scandinavians | 65.1 /100 | #166 | Good $86,073 |
| Immigrants | Immigrants | 61.3 /100 | #167 | Good $85,818 |
| Icelanders | 61.0 /100 | #168 | Good $85,797 |
| Colombians | 59.7 /100 | #169 | Average $85,716 |
| Swiss | 59.2 /100 | #170 | Average $85,681 |
| Immigrants | South America | 58.1 /100 | #171 | Average $85,611 |