Lebanese vs Slavic Householder Income Over 65 years
COMPARE
Lebanese
Slavic
Householder Income Over 65 years
Householder Income Over 65 years Comparison
Lebanese
Slavs
$62,287
HOUSEHOLDER INCOME OVER 65 YEARS
79.9/ 100
METRIC RATING
139th/ 347
METRIC RANK
$61,709
HOUSEHOLDER INCOME OVER 65 YEARS
68.5/ 100
METRIC RATING
150th/ 347
METRIC RANK
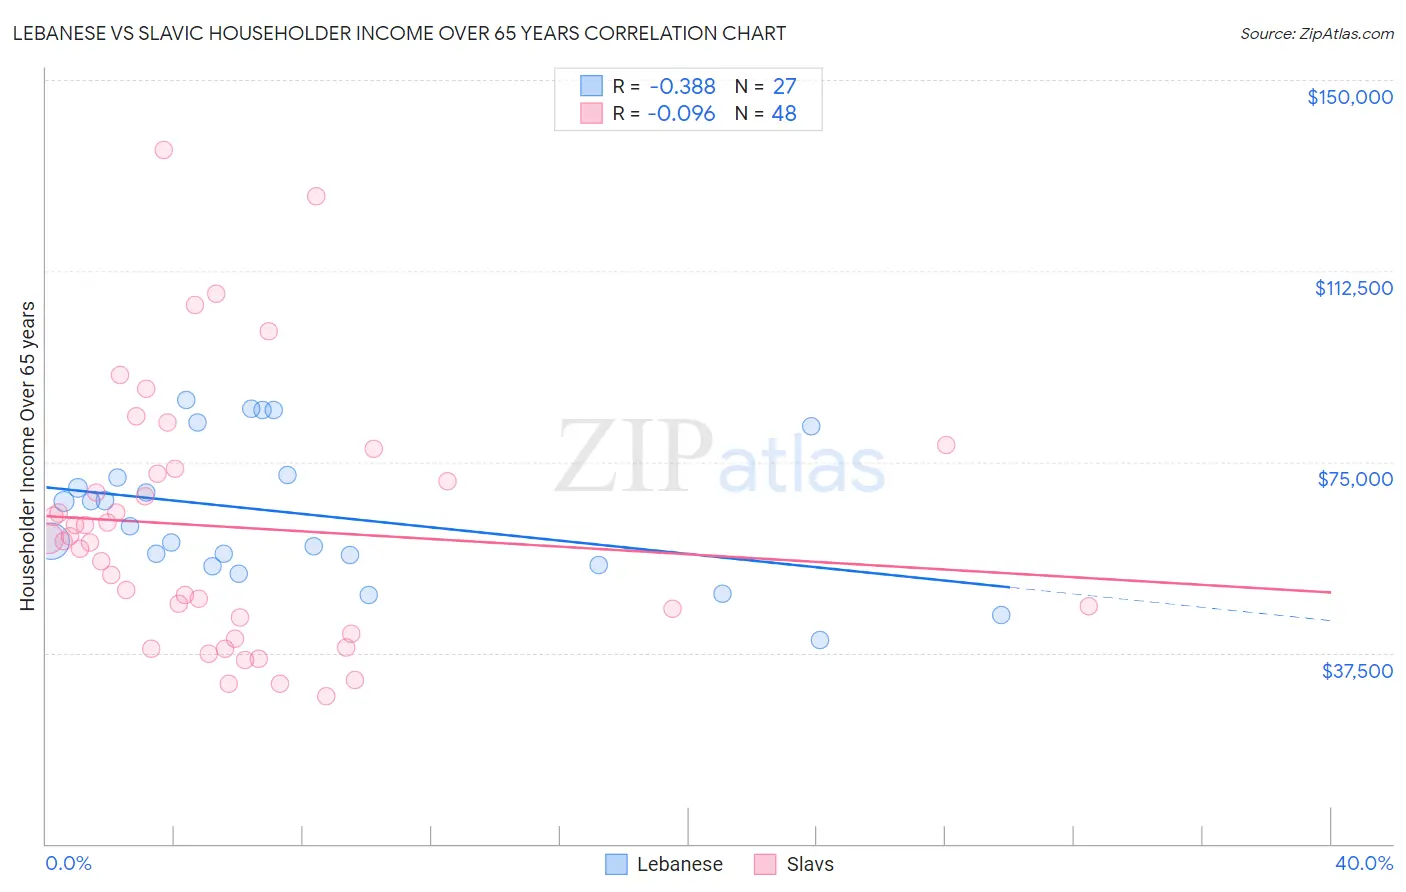
Lebanese vs Slavic Householder Income Over 65 years Correlation Chart
The statistical analysis conducted on geographies consisting of 400,240,263 people shows a mild negative correlation between the proportion of Lebanese and household income with householder over the age of 65 in the United States with a correlation coefficient (R) of -0.388 and weighted average of $62,287. Similarly, the statistical analysis conducted on geographies consisting of 270,416,943 people shows a slight negative correlation between the proportion of Slavs and household income with householder over the age of 65 in the United States with a correlation coefficient (R) of -0.096 and weighted average of $61,709, a difference of 0.94%.
Householder Income Over 65 years Correlation Summary
| Measurement | Lebanese | Slavic |
| Minimum | $39,905 | $29,063 |
| Maximum | $87,260 | $136,135 |
| Range | $47,355 | $107,072 |
| Mean | $64,724 | $62,217 |
| Median | $62,393 | $59,730 |
| Interquartile 25% (IQ1) | $54,830 | $42,874 |
| Interquartile 75% (IQ3) | $72,386 | $73,140 |
| Interquartile Range (IQR) | $17,556 | $30,267 |
| Standard Deviation (Sample) | $13,483 | $24,786 |
| Standard Deviation (Population) | $13,231 | $24,526 |
Demographics Similar to Lebanese and Slavs by Householder Income Over 65 years
In terms of householder income over 65 years, the demographic groups most similar to Lebanese are Immigrants from Kazakhstan ($62,292, a difference of 0.010%), Immigrants from Syria ($62,303, a difference of 0.030%), Arab ($62,266, a difference of 0.030%), Alaskan Athabascan ($62,330, a difference of 0.070%), and Canadian ($62,230, a difference of 0.090%). Similarly, the demographic groups most similar to Slavs are Scottish ($61,735, a difference of 0.040%), Hungarian ($61,673, a difference of 0.060%), Armenian ($61,656, a difference of 0.090%), Costa Rican ($61,638, a difference of 0.12%), and Alsatian ($61,797, a difference of 0.14%).
| Demographics | Rating | Rank | Householder Income Over 65 years |
| Immigrants | Brazil | 81.2 /100 | #134 | Excellent $62,364 |
| Immigrants | Chile | 81.0 /100 | #135 | Excellent $62,354 |
| Alaskan Athabascans | 80.6 /100 | #136 | Excellent $62,330 |
| Immigrants | Syria | 80.2 /100 | #137 | Excellent $62,303 |
| Immigrants | Kazakhstan | 80.0 /100 | #138 | Excellent $62,292 |
| Lebanese | 79.9 /100 | #139 | Good $62,287 |
| Arabs | 79.6 /100 | #140 | Good $62,266 |
| Canadians | 79.0 /100 | #141 | Good $62,230 |
| South American Indians | 78.7 /100 | #142 | Good $62,215 |
| Immigrants | Belarus | 77.8 /100 | #143 | Good $62,162 |
| Immigrants | Peru | 74.4 /100 | #144 | Good $61,988 |
| Immigrants | Uganda | 74.2 /100 | #145 | Good $61,976 |
| Immigrants | Southern Europe | 72.7 /100 | #146 | Good $61,902 |
| Immigrants | Nepal | 71.4 /100 | #147 | Good $61,843 |
| Alsatians | 70.5 /100 | #148 | Good $61,797 |
| Scottish | 69.1 /100 | #149 | Good $61,735 |
| Slavs | 68.5 /100 | #150 | Good $61,709 |
| Hungarians | 67.7 /100 | #151 | Good $61,673 |
| Armenians | 67.3 /100 | #152 | Good $61,656 |
| Costa Ricans | 66.9 /100 | #153 | Good $61,638 |
| Swiss | 66.5 /100 | #154 | Good $61,621 |