French American Indian vs Slavic Householder Income Over 65 years
COMPARE
French American Indian
Slavic
Householder Income Over 65 years
Householder Income Over 65 years Comparison
French American Indians
Slavs
$54,699
HOUSEHOLDER INCOME OVER 65 YEARS
0.1/ 100
METRIC RATING
263rd/ 347
METRIC RANK
$61,709
HOUSEHOLDER INCOME OVER 65 YEARS
68.5/ 100
METRIC RATING
150th/ 347
METRIC RANK
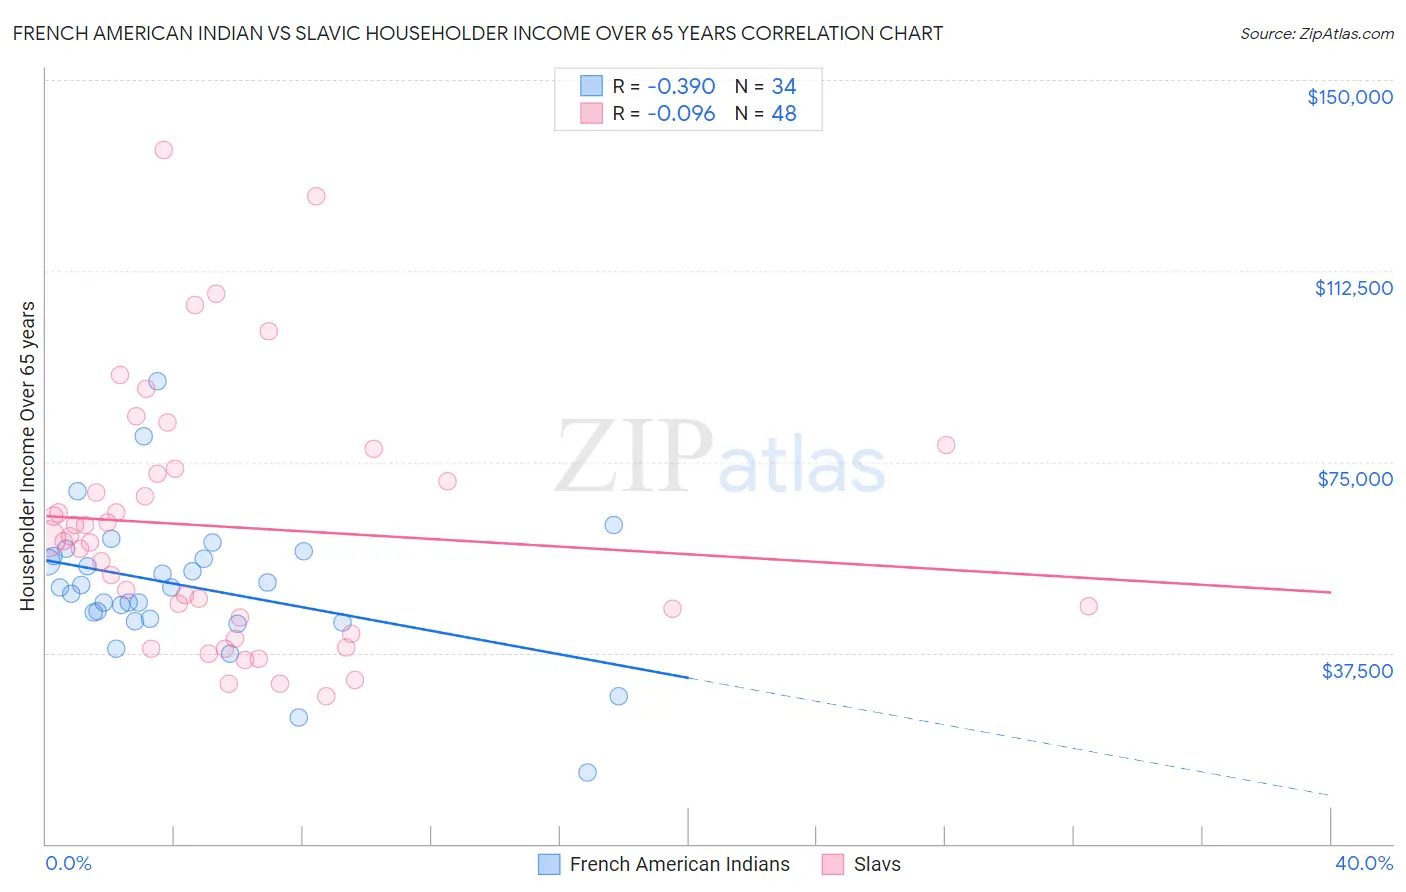
French American Indian vs Slavic Householder Income Over 65 years Correlation Chart
The statistical analysis conducted on geographies consisting of 131,860,683 people shows a mild negative correlation between the proportion of French American Indians and household income with householder over the age of 65 in the United States with a correlation coefficient (R) of -0.390 and weighted average of $54,699. Similarly, the statistical analysis conducted on geographies consisting of 270,416,943 people shows a slight negative correlation between the proportion of Slavs and household income with householder over the age of 65 in the United States with a correlation coefficient (R) of -0.096 and weighted average of $61,709, a difference of 12.8%.
Householder Income Over 65 years Correlation Summary
| Measurement | French American Indian | Slavic |
| Minimum | $13,958 | $29,063 |
| Maximum | $90,764 | $136,135 |
| Range | $76,806 | $107,072 |
| Mean | $50,471 | $62,217 |
| Median | $50,313 | $59,730 |
| Interquartile 25% (IQ1) | $44,258 | $42,874 |
| Interquartile 75% (IQ3) | $56,532 | $73,140 |
| Interquartile Range (IQR) | $12,274 | $30,267 |
| Standard Deviation (Sample) | $13,962 | $24,786 |
| Standard Deviation (Population) | $13,755 | $24,526 |
Similar Demographics by Householder Income Over 65 years
Demographics Similar to French American Indians by Householder Income Over 65 years
In terms of householder income over 65 years, the demographic groups most similar to French American Indians are Bangladeshi ($54,719, a difference of 0.040%), Apache ($54,668, a difference of 0.060%), Belizean ($54,580, a difference of 0.22%), Jamaican ($54,560, a difference of 0.25%), and Guatemalan ($54,526, a difference of 0.32%).
| Demographics | Rating | Rank | Householder Income Over 65 years |
| German Russians | 0.3 /100 | #256 | Tragic $55,356 |
| Trinidadians and Tobagonians | 0.3 /100 | #257 | Tragic $55,327 |
| Ecuadorians | 0.2 /100 | #258 | Tragic $54,958 |
| West Indians | 0.2 /100 | #259 | Tragic $54,936 |
| Immigrants | West Indies | 0.2 /100 | #260 | Tragic $54,927 |
| Comanche | 0.2 /100 | #261 | Tragic $54,922 |
| Bangladeshis | 0.1 /100 | #262 | Tragic $54,719 |
| French American Indians | 0.1 /100 | #263 | Tragic $54,699 |
| Apache | 0.1 /100 | #264 | Tragic $54,668 |
| Belizeans | 0.1 /100 | #265 | Tragic $54,580 |
| Jamaicans | 0.1 /100 | #266 | Tragic $54,560 |
| Guatemalans | 0.1 /100 | #267 | Tragic $54,526 |
| Immigrants | Zaire | 0.1 /100 | #268 | Tragic $54,512 |
| Nicaraguans | 0.1 /100 | #269 | Tragic $54,474 |
| Immigrants | Senegal | 0.1 /100 | #270 | Tragic $54,447 |
Demographics Similar to Slavs by Householder Income Over 65 years
In terms of householder income over 65 years, the demographic groups most similar to Slavs are Scottish ($61,735, a difference of 0.040%), Hungarian ($61,673, a difference of 0.060%), Armenian ($61,656, a difference of 0.090%), Costa Rican ($61,638, a difference of 0.12%), and Alsatian ($61,797, a difference of 0.14%).
| Demographics | Rating | Rank | Householder Income Over 65 years |
| Immigrants | Belarus | 77.8 /100 | #143 | Good $62,162 |
| Immigrants | Peru | 74.4 /100 | #144 | Good $61,988 |
| Immigrants | Uganda | 74.2 /100 | #145 | Good $61,976 |
| Immigrants | Southern Europe | 72.7 /100 | #146 | Good $61,902 |
| Immigrants | Nepal | 71.4 /100 | #147 | Good $61,843 |
| Alsatians | 70.5 /100 | #148 | Good $61,797 |
| Scottish | 69.1 /100 | #149 | Good $61,735 |
| Slavs | 68.5 /100 | #150 | Good $61,709 |
| Hungarians | 67.7 /100 | #151 | Good $61,673 |
| Armenians | 67.3 /100 | #152 | Good $61,656 |
| Costa Ricans | 66.9 /100 | #153 | Good $61,638 |
| Swiss | 66.5 /100 | #154 | Good $61,621 |
| Poles | 65.9 /100 | #155 | Good $61,598 |
| Scandinavians | 65.6 /100 | #156 | Good $61,586 |
| Macedonians | 65.1 /100 | #157 | Good $61,564 |