Immigrants from Bolivia vs Indonesian Householder Income Ages 45 - 64 years
COMPARE
Immigrants from Bolivia
Indonesian
Householder Income Ages 45 - 64 years
Householder Income Ages 45 - 64 years Comparison
Immigrants from Bolivia
Indonesians
$117,731
HOUSEHOLDER INCOME AGES 45 - 64 YEARS
100.0/ 100
METRIC RATING
30th/ 347
METRIC RANK
$84,890
HOUSEHOLDER INCOME AGES 45 - 64 YEARS
0.0/ 100
METRIC RATING
300th/ 347
METRIC RANK
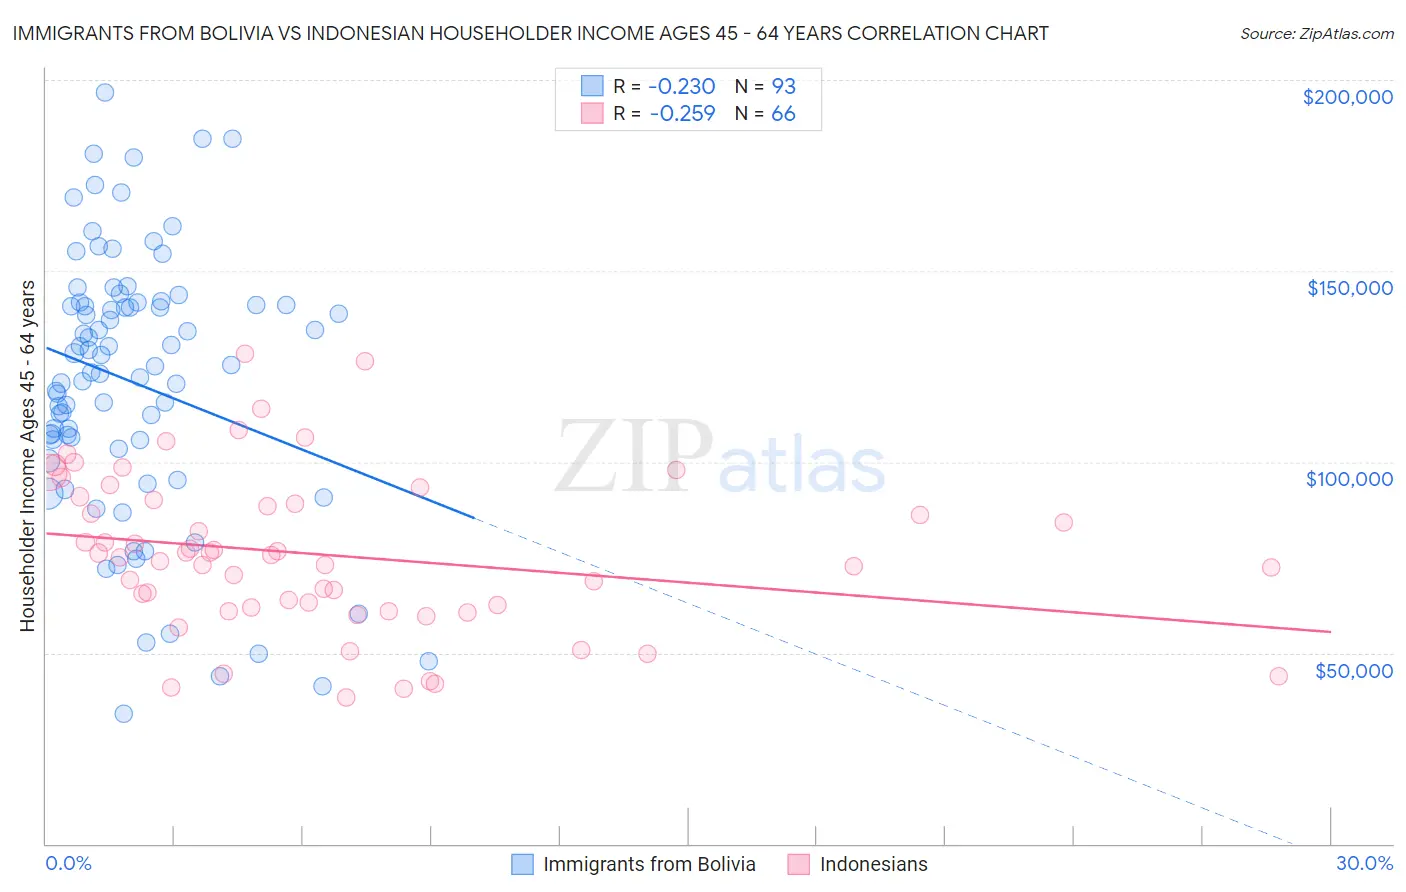
Immigrants from Bolivia vs Indonesian Householder Income Ages 45 - 64 years Correlation Chart
The statistical analysis conducted on geographies consisting of 158,694,143 people shows a weak negative correlation between the proportion of Immigrants from Bolivia and household income with householder between the ages 45 and 64 in the United States with a correlation coefficient (R) of -0.230 and weighted average of $117,731. Similarly, the statistical analysis conducted on geographies consisting of 162,545,681 people shows a weak negative correlation between the proportion of Indonesians and household income with householder between the ages 45 and 64 in the United States with a correlation coefficient (R) of -0.259 and weighted average of $84,890, a difference of 38.7%.
Householder Income Ages 45 - 64 years Correlation Summary
| Measurement | Immigrants from Bolivia | Indonesian |
| Minimum | $33,906 | $38,314 |
| Maximum | $196,601 | $128,309 |
| Range | $162,695 | $89,995 |
| Mean | $120,740 | $75,761 |
| Median | $124,893 | $75,282 |
| Interquartile 25% (IQ1) | $104,523 | $61,778 |
| Interquartile 75% (IQ3) | $141,314 | $90,077 |
| Interquartile Range (IQR) | $36,791 | $28,299 |
| Standard Deviation (Sample) | $34,819 | $20,717 |
| Standard Deviation (Population) | $34,631 | $20,559 |
Similar Demographics by Householder Income Ages 45 - 64 years
Demographics Similar to Immigrants from Bolivia by Householder Income Ages 45 - 64 years
In terms of householder income ages 45 - 64 years, the demographic groups most similar to Immigrants from Bolivia are Bhutanese ($117,750, a difference of 0.020%), Turkish ($117,814, a difference of 0.070%), Immigrants from Northern Europe ($117,930, a difference of 0.17%), Immigrants from Sweden ($118,318, a difference of 0.50%), and Asian ($118,426, a difference of 0.59%).
| Demographics | Rating | Rank | Householder Income Ages 45 - 64 years |
| Bolivians | 100.0 /100 | #23 | Exceptional $118,871 |
| Immigrants | Japan | 100.0 /100 | #24 | Exceptional $118,498 |
| Asians | 100.0 /100 | #25 | Exceptional $118,426 |
| Immigrants | Sweden | 100.0 /100 | #26 | Exceptional $118,318 |
| Immigrants | Northern Europe | 100.0 /100 | #27 | Exceptional $117,930 |
| Turks | 100.0 /100 | #28 | Exceptional $117,814 |
| Bhutanese | 100.0 /100 | #29 | Exceptional $117,750 |
| Immigrants | Bolivia | 100.0 /100 | #30 | Exceptional $117,731 |
| Immigrants | Asia | 100.0 /100 | #31 | Exceptional $116,566 |
| Russians | 100.0 /100 | #32 | Exceptional $116,328 |
| Chinese | 100.0 /100 | #33 | Exceptional $116,156 |
| Immigrants | Denmark | 100.0 /100 | #34 | Exceptional $116,000 |
| Latvians | 100.0 /100 | #35 | Exceptional $115,957 |
| Immigrants | Switzerland | 100.0 /100 | #36 | Exceptional $115,934 |
| Maltese | 99.9 /100 | #37 | Exceptional $114,754 |
Demographics Similar to Indonesians by Householder Income Ages 45 - 64 years
In terms of householder income ages 45 - 64 years, the demographic groups most similar to Indonesians are Immigrants from Mexico ($84,910, a difference of 0.020%), African ($84,925, a difference of 0.040%), Potawatomi ($84,613, a difference of 0.33%), Fijian ($85,187, a difference of 0.35%), and Immigrants from Zaire ($85,207, a difference of 0.37%).
| Demographics | Rating | Rank | Householder Income Ages 45 - 64 years |
| Comanche | 0.1 /100 | #293 | Tragic $85,787 |
| British West Indians | 0.1 /100 | #294 | Tragic $85,571 |
| Immigrants | Grenada | 0.1 /100 | #295 | Tragic $85,552 |
| Immigrants | Zaire | 0.1 /100 | #296 | Tragic $85,207 |
| Fijians | 0.1 /100 | #297 | Tragic $85,187 |
| Africans | 0.0 /100 | #298 | Tragic $84,925 |
| Immigrants | Mexico | 0.0 /100 | #299 | Tragic $84,910 |
| Indonesians | 0.0 /100 | #300 | Tragic $84,890 |
| Potawatomi | 0.0 /100 | #301 | Tragic $84,613 |
| Haitians | 0.0 /100 | #302 | Tragic $84,384 |
| Hondurans | 0.0 /100 | #303 | Tragic $84,079 |
| Ottawa | 0.0 /100 | #304 | Tragic $83,953 |
| Chippewa | 0.0 /100 | #305 | Tragic $83,943 |
| Ute | 0.0 /100 | #306 | Tragic $83,937 |
| Shoshone | 0.0 /100 | #307 | Tragic $83,588 |