Latvian vs Greek Median Family Income
COMPARE
Latvian
Greek
Median Family Income
Median Family Income Comparison
Latvians
Greeks
$120,301
MEDIAN FAMILY INCOME
100.0/ 100
METRIC RATING
29th/ 347
METRIC RANK
$115,192
MEDIAN FAMILY INCOME
99.8/ 100
METRIC RATING
57th/ 347
METRIC RANK
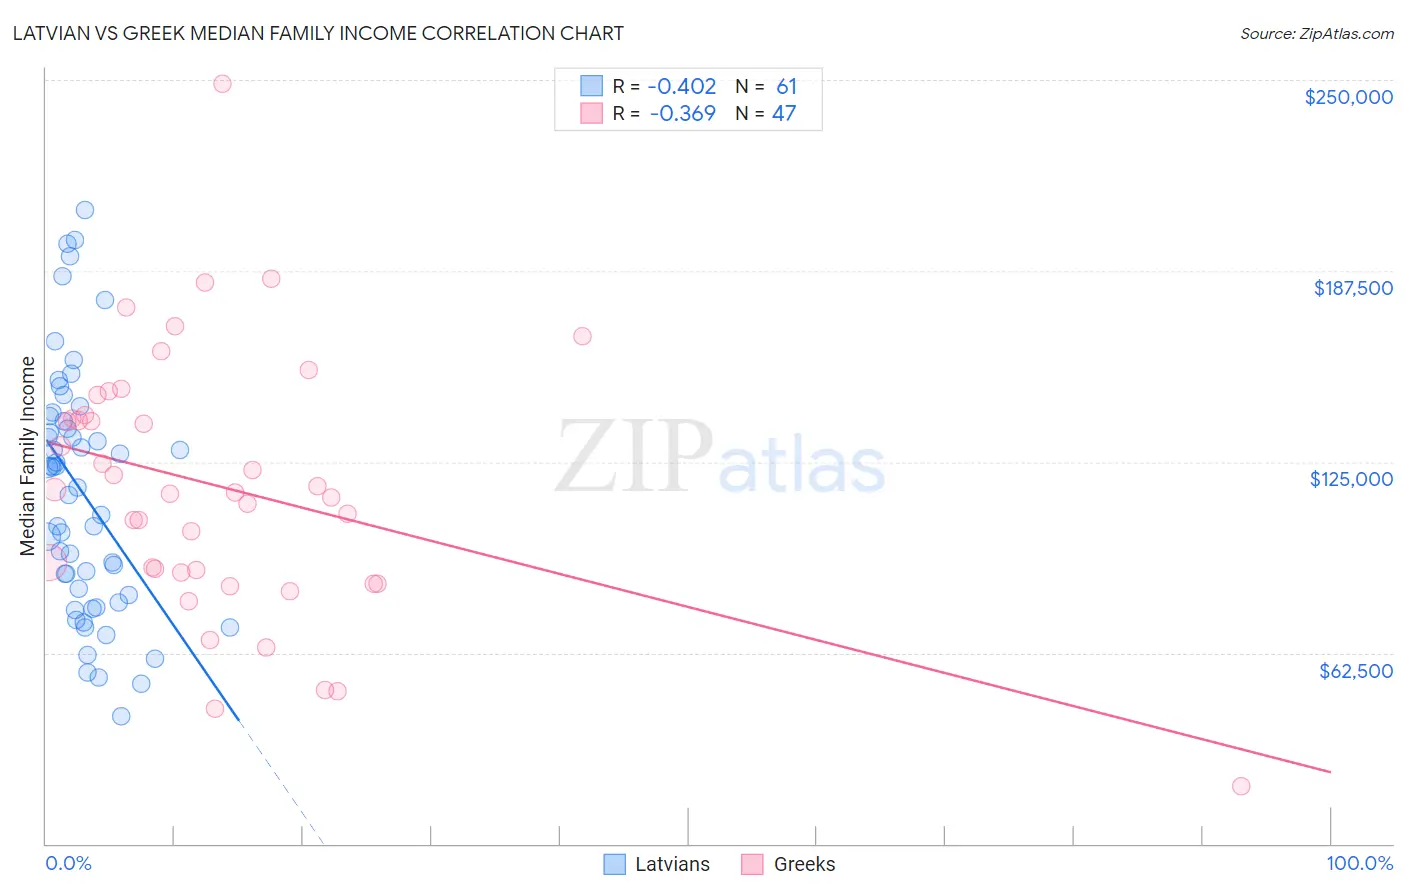
Latvian vs Greek Median Family Income Correlation Chart
The statistical analysis conducted on geographies consisting of 220,626,536 people shows a moderate negative correlation between the proportion of Latvians and median family income in the United States with a correlation coefficient (R) of -0.402 and weighted average of $120,301. Similarly, the statistical analysis conducted on geographies consisting of 482,131,670 people shows a mild negative correlation between the proportion of Greeks and median family income in the United States with a correlation coefficient (R) of -0.369 and weighted average of $115,192, a difference of 4.4%.
Median Family Income Correlation Summary
| Measurement | Latvian | Greek |
| Minimum | $41,641 | $18,825 |
| Maximum | $207,328 | $248,750 |
| Range | $165,687 | $229,925 |
| Mean | $114,631 | $116,811 |
| Median | $116,635 | $115,024 |
| Interquartile 25% (IQ1) | $80,254 | $88,890 |
| Interquartile 75% (IQ3) | $139,118 | $140,272 |
| Interquartile Range (IQR) | $58,864 | $51,382 |
| Standard Deviation (Sample) | $40,043 | $42,578 |
| Standard Deviation (Population) | $39,714 | $42,122 |
Similar Demographics by Median Family Income
Demographics Similar to Latvians by Median Family Income
In terms of median family income, the demographic groups most similar to Latvians are Immigrants from Sri Lanka ($120,263, a difference of 0.030%), Immigrants from Denmark ($120,445, a difference of 0.12%), Russian ($120,487, a difference of 0.15%), Immigrants from France ($120,076, a difference of 0.19%), and Asian ($119,955, a difference of 0.29%).
| Demographics | Rating | Rank | Median Family Income |
| Immigrants | Sweden | 100.0 /100 | #22 | Exceptional $122,765 |
| Immigrants | Japan | 100.0 /100 | #23 | Exceptional $122,764 |
| Immigrants | Northern Europe | 100.0 /100 | #24 | Exceptional $121,840 |
| Turks | 100.0 /100 | #25 | Exceptional $121,202 |
| Immigrants | Switzerland | 100.0 /100 | #26 | Exceptional $120,726 |
| Russians | 100.0 /100 | #27 | Exceptional $120,487 |
| Immigrants | Denmark | 100.0 /100 | #28 | Exceptional $120,445 |
| Latvians | 100.0 /100 | #29 | Exceptional $120,301 |
| Immigrants | Sri Lanka | 100.0 /100 | #30 | Exceptional $120,263 |
| Immigrants | France | 100.0 /100 | #31 | Exceptional $120,076 |
| Asians | 100.0 /100 | #32 | Exceptional $119,955 |
| Bhutanese | 100.0 /100 | #33 | Exceptional $119,800 |
| Bolivians | 100.0 /100 | #34 | Exceptional $119,479 |
| Soviet Union | 100.0 /100 | #35 | Exceptional $119,262 |
| Israelis | 100.0 /100 | #36 | Exceptional $118,577 |
Demographics Similar to Greeks by Median Family Income
In terms of median family income, the demographic groups most similar to Greeks are New Zealander ($115,230, a difference of 0.030%), Immigrants from Indonesia ($115,162, a difference of 0.030%), Lithuanian ($115,395, a difference of 0.18%), Immigrants from Netherlands ($114,987, a difference of 0.18%), and Immigrants from Europe ($115,523, a difference of 0.29%).
| Demographics | Rating | Rank | Median Family Income |
| Immigrants | Czechoslovakia | 99.9 /100 | #50 | Exceptional $116,165 |
| Immigrants | Malaysia | 99.9 /100 | #51 | Exceptional $115,880 |
| Maltese | 99.9 /100 | #52 | Exceptional $115,862 |
| Immigrants | Norway | 99.9 /100 | #53 | Exceptional $115,847 |
| Immigrants | Europe | 99.9 /100 | #54 | Exceptional $115,523 |
| Lithuanians | 99.8 /100 | #55 | Exceptional $115,395 |
| New Zealanders | 99.8 /100 | #56 | Exceptional $115,230 |
| Greeks | 99.8 /100 | #57 | Exceptional $115,192 |
| Immigrants | Indonesia | 99.8 /100 | #58 | Exceptional $115,162 |
| Immigrants | Netherlands | 99.8 /100 | #59 | Exceptional $114,987 |
| Immigrants | Latvia | 99.8 /100 | #60 | Exceptional $114,826 |
| Immigrants | Belarus | 99.8 /100 | #61 | Exceptional $114,586 |
| Mongolians | 99.8 /100 | #62 | Exceptional $114,553 |
| Immigrants | Pakistan | 99.8 /100 | #63 | Exceptional $114,406 |
| Immigrants | Scotland | 99.7 /100 | #64 | Exceptional $114,392 |