Jordanian vs Hmong Per Capita Income
COMPARE
Jordanian
Hmong
Per Capita Income
Per Capita Income Comparison
Jordanians
Hmong
$45,605
PER CAPITA INCOME
89.9/ 100
METRIC RATING
132nd/ 347
METRIC RANK
$38,120
PER CAPITA INCOME
0.2/ 100
METRIC RATING
276th/ 347
METRIC RANK
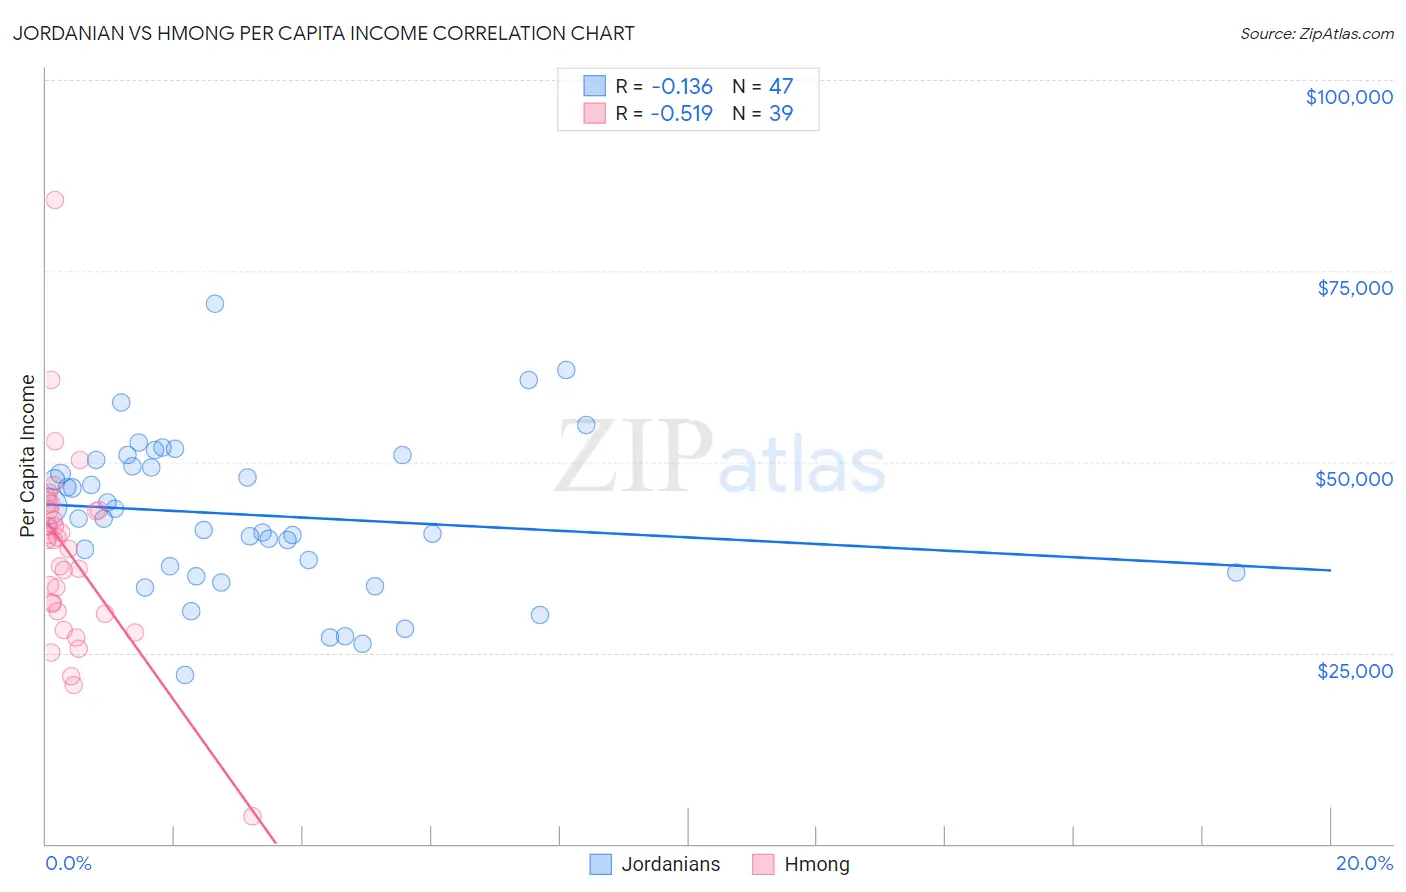
Jordanian vs Hmong Per Capita Income Correlation Chart
The statistical analysis conducted on geographies consisting of 166,389,755 people shows a poor negative correlation between the proportion of Jordanians and per capita income in the United States with a correlation coefficient (R) of -0.136 and weighted average of $45,605. Similarly, the statistical analysis conducted on geographies consisting of 24,672,334 people shows a substantial negative correlation between the proportion of Hmong and per capita income in the United States with a correlation coefficient (R) of -0.519 and weighted average of $38,120, a difference of 19.6%.
Per Capita Income Correlation Summary
| Measurement | Jordanian | Hmong |
| Minimum | $22,143 | $3,563 |
| Maximum | $70,697 | $84,315 |
| Range | $48,554 | $80,752 |
| Mean | $43,077 | $38,244 |
| Median | $42,576 | $39,777 |
| Interquartile 25% (IQ1) | $35,594 | $30,464 |
| Interquartile 75% (IQ3) | $50,277 | $43,732 |
| Interquartile Range (IQR) | $14,683 | $13,268 |
| Standard Deviation (Sample) | $10,214 | $12,703 |
| Standard Deviation (Population) | $10,105 | $12,539 |
Similar Demographics by Per Capita Income
Demographics Similar to Jordanians by Per Capita Income
In terms of per capita income, the demographic groups most similar to Jordanians are Immigrants from North Macedonia ($45,622, a difference of 0.040%), Pakistani ($45,587, a difference of 0.040%), Slovene ($45,581, a difference of 0.050%), Arab ($45,662, a difference of 0.12%), and Luxembourger ($45,663, a difference of 0.13%).
| Demographics | Rating | Rank | Per Capita Income |
| Zimbabweans | 91.7 /100 | #125 | Exceptional $45,804 |
| Palestinians | 91.6 /100 | #126 | Exceptional $45,790 |
| Immigrants | Germany | 91.3 /100 | #127 | Exceptional $45,751 |
| Swedes | 91.3 /100 | #128 | Exceptional $45,750 |
| Luxembourgers | 90.4 /100 | #129 | Exceptional $45,663 |
| Arabs | 90.4 /100 | #130 | Exceptional $45,662 |
| Immigrants | North Macedonia | 90.0 /100 | #131 | Exceptional $45,622 |
| Jordanians | 89.9 /100 | #132 | Excellent $45,605 |
| Pakistanis | 89.7 /100 | #133 | Excellent $45,587 |
| Slovenes | 89.6 /100 | #134 | Excellent $45,581 |
| Hungarians | 87.9 /100 | #135 | Excellent $45,426 |
| Immigrants | Oceania | 85.2 /100 | #136 | Excellent $45,220 |
| Immigrants | Syria | 85.2 /100 | #137 | Excellent $45,218 |
| Assyrians/Chaldeans/Syriacs | 84.8 /100 | #138 | Excellent $45,195 |
| Basques | 83.2 /100 | #139 | Excellent $45,086 |
Demographics Similar to Hmong by Per Capita Income
In terms of per capita income, the demographic groups most similar to Hmong are Comanche ($38,088, a difference of 0.080%), Immigrants from Liberia ($38,165, a difference of 0.12%), Immigrants from Nicaragua ($38,065, a difference of 0.15%), Colville ($38,047, a difference of 0.19%), and Potawatomi ($38,046, a difference of 0.20%).
| Demographics | Rating | Rank | Per Capita Income |
| Immigrants | Jamaica | 0.4 /100 | #269 | Tragic $38,766 |
| Immigrants | Belize | 0.3 /100 | #270 | Tragic $38,614 |
| Central Americans | 0.3 /100 | #271 | Tragic $38,560 |
| Immigrants | Cabo Verde | 0.3 /100 | #272 | Tragic $38,540 |
| Nepalese | 0.3 /100 | #273 | Tragic $38,442 |
| Immigrants | El Salvador | 0.3 /100 | #274 | Tragic $38,394 |
| Immigrants | Liberia | 0.2 /100 | #275 | Tragic $38,165 |
| Hmong | 0.2 /100 | #276 | Tragic $38,120 |
| Comanche | 0.2 /100 | #277 | Tragic $38,088 |
| Immigrants | Nicaragua | 0.2 /100 | #278 | Tragic $38,065 |
| Colville | 0.2 /100 | #279 | Tragic $38,047 |
| Potawatomi | 0.2 /100 | #280 | Tragic $38,046 |
| Immigrants | Dominica | 0.2 /100 | #281 | Tragic $37,952 |
| Immigrants | Laos | 0.1 /100 | #282 | Tragic $37,857 |
| Pennsylvania Germans | 0.1 /100 | #283 | Tragic $37,842 |