Jamaican vs French Householder Income Under 25 years
COMPARE
Jamaican
French
Householder Income Under 25 years
Householder Income Under 25 years Comparison
Jamaicans
French
$50,929
HOUSEHOLDER INCOME UNDER 25 YEARS
4.4/ 100
METRIC RATING
230th/ 347
METRIC RANK
$51,230
HOUSEHOLDER INCOME UNDER 25 YEARS
8.7/ 100
METRIC RATING
216th/ 347
METRIC RANK
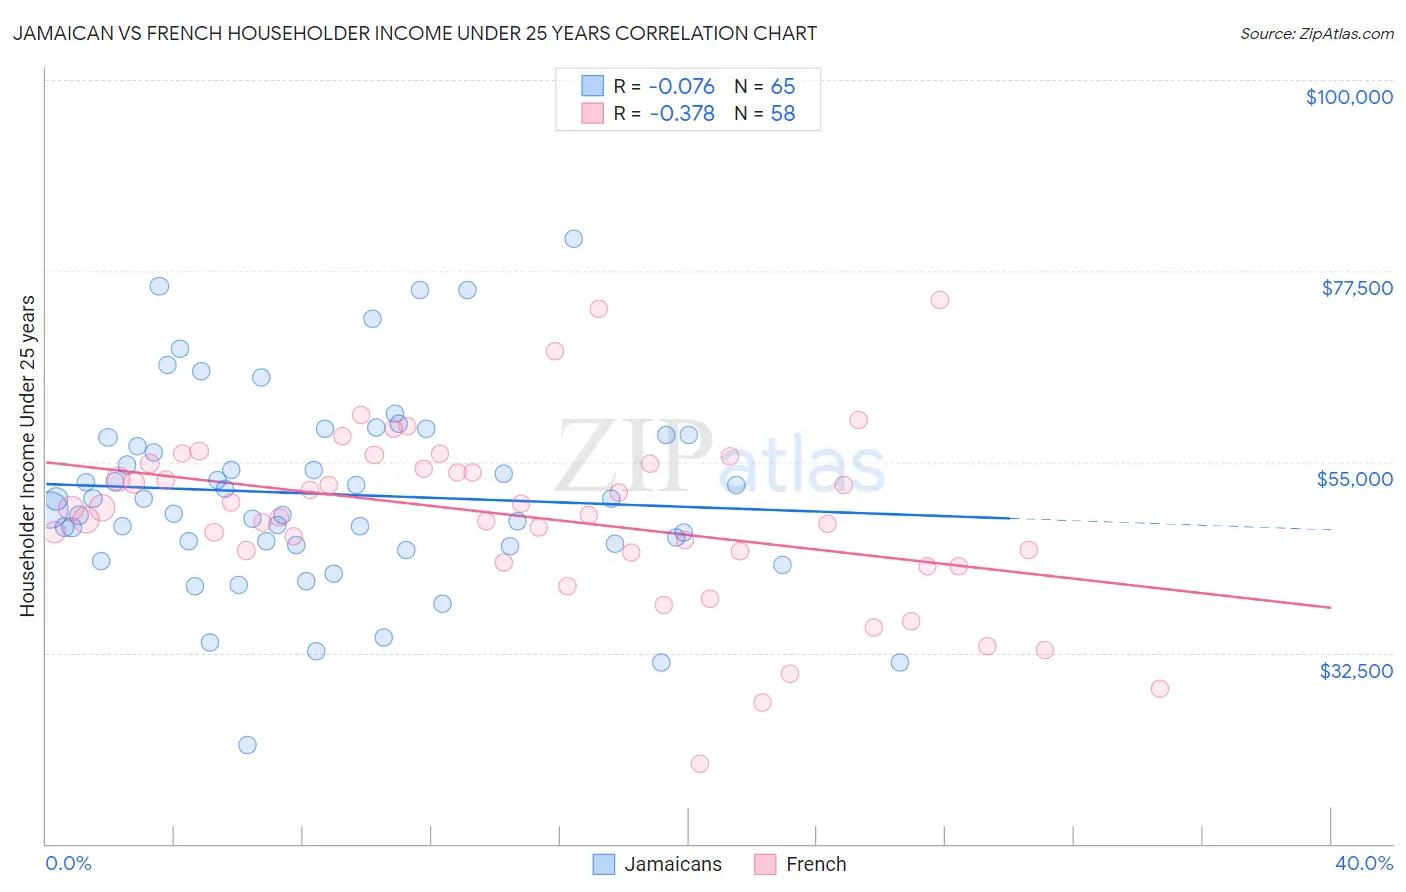
Jamaican vs French Householder Income Under 25 years Correlation Chart
The statistical analysis conducted on geographies consisting of 311,962,738 people shows a slight negative correlation between the proportion of Jamaicans and household income with householder under the age of 25 in the United States with a correlation coefficient (R) of -0.076 and weighted average of $50,929. Similarly, the statistical analysis conducted on geographies consisting of 439,498,922 people shows a mild negative correlation between the proportion of French and household income with householder under the age of 25 in the United States with a correlation coefficient (R) of -0.378 and weighted average of $51,230, a difference of 0.59%.
Householder Income Under 25 years Correlation Summary
| Measurement | Jamaican | French |
| Minimum | $21,667 | $19,435 |
| Maximum | $81,354 | $74,028 |
| Range | $59,687 | $54,593 |
| Mean | $51,206 | $48,553 |
| Median | $50,597 | $49,097 |
| Interquartile 25% (IQ1) | $45,297 | $44,353 |
| Interquartile 75% (IQ3) | $58,010 | $54,784 |
| Interquartile Range (IQR) | $12,713 | $10,431 |
| Standard Deviation (Sample) | $11,380 | $10,339 |
| Standard Deviation (Population) | $11,292 | $10,250 |
Demographics Similar to Jamaicans and French by Householder Income Under 25 years
In terms of householder income under 25 years, the demographic groups most similar to Jamaicans are Yuman ($50,933, a difference of 0.010%), Ugandan ($50,923, a difference of 0.010%), Slovene ($50,886, a difference of 0.080%), Immigrants from Norway ($50,984, a difference of 0.11%), and Pennsylvania German ($50,852, a difference of 0.15%). Similarly, the demographic groups most similar to French are Czechoslovakian ($51,224, a difference of 0.010%), Immigrants from Belize ($51,223, a difference of 0.010%), Arab ($51,219, a difference of 0.020%), Icelander ($51,247, a difference of 0.030%), and Zimbabwean ($51,259, a difference of 0.060%).
| Demographics | Rating | Rank | Householder Income Under 25 years |
| Dutch | 9.4 /100 | #213 | Tragic $51,265 |
| Zimbabweans | 9.3 /100 | #214 | Tragic $51,259 |
| Icelanders | 9.1 /100 | #215 | Tragic $51,247 |
| French | 8.7 /100 | #216 | Tragic $51,230 |
| Czechoslovakians | 8.6 /100 | #217 | Tragic $51,224 |
| Immigrants | Belize | 8.6 /100 | #218 | Tragic $51,223 |
| Arabs | 8.5 /100 | #219 | Tragic $51,219 |
| Immigrants | Germany | 8.0 /100 | #220 | Tragic $51,190 |
| Immigrants | Eastern Africa | 7.4 /100 | #221 | Tragic $51,158 |
| Spaniards | 6.8 /100 | #222 | Tragic $51,117 |
| Serbians | 6.6 /100 | #223 | Tragic $51,106 |
| Belizeans | 6.4 /100 | #224 | Tragic $51,094 |
| Immigrants | Jamaica | 5.6 /100 | #225 | Tragic $51,038 |
| Yugoslavians | 5.5 /100 | #226 | Tragic $51,028 |
| Immigrants | Central America | 5.4 /100 | #227 | Tragic $51,022 |
| Immigrants | Norway | 5.0 /100 | #228 | Tragic $50,984 |
| Yuman | 4.4 /100 | #229 | Tragic $50,933 |
| Jamaicans | 4.4 /100 | #230 | Tragic $50,929 |
| Ugandans | 4.3 /100 | #231 | Tragic $50,923 |
| Slovenes | 4.0 /100 | #232 | Tragic $50,886 |
| Pennsylvania Germans | 3.7 /100 | #233 | Tragic $50,852 |