Jamaican vs Scottish Family Households with Children
COMPARE
Jamaican
Scottish
Family Households with Children
Family Households with Children Comparison
Jamaicans
Scottish
26.9%
FAMILY HOUSEHOLDS WITH CHILDREN
2.5/ 100
METRIC RATING
246th/ 347
METRIC RANK
27.0%
FAMILY HOUSEHOLDS WITH CHILDREN
6.5/ 100
METRIC RATING
228th/ 347
METRIC RANK
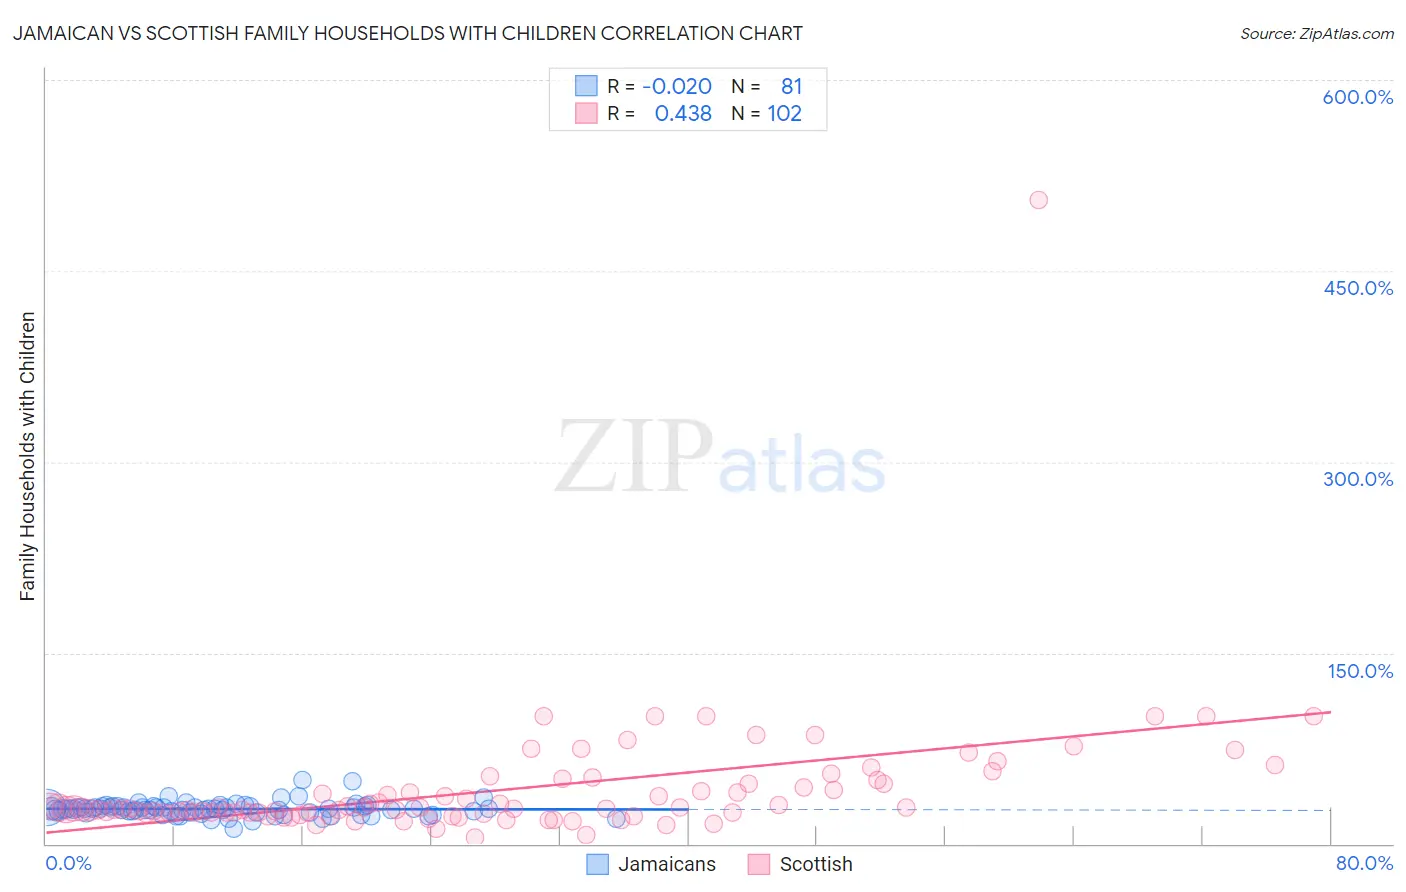
Jamaican vs Scottish Family Households with Children Correlation Chart
The statistical analysis conducted on geographies consisting of 367,528,470 people shows no correlation between the proportion of Jamaicans and percentage of family households with children in the United States with a correlation coefficient (R) of -0.020 and weighted average of 26.9%. Similarly, the statistical analysis conducted on geographies consisting of 566,154,348 people shows a moderate positive correlation between the proportion of Scottish and percentage of family households with children in the United States with a correlation coefficient (R) of 0.438 and weighted average of 27.0%, a difference of 0.58%.
Family Households with Children Correlation Summary
| Measurement | Jamaican | Scottish |
| Minimum | 11.8% | 5.1% |
| Maximum | 50.0% | 505.5% |
| Range | 38.2% | 500.4% |
| Mean | 27.3% | 42.0% |
| Median | 27.2% | 27.3% |
| Interquartile 25% (IQ1) | 24.5% | 24.2% |
| Interquartile 75% (IQ3) | 29.1% | 47.1% |
| Interquartile Range (IQR) | 4.5% | 22.9% |
| Standard Deviation (Sample) | 5.5% | 51.9% |
| Standard Deviation (Population) | 5.5% | 51.6% |
Demographics Similar to Jamaicans and Scottish by Family Households with Children
In terms of family households with children, the demographic groups most similar to Jamaicans are Potawatomi (26.9%, a difference of 0.060%), Australian (26.9%, a difference of 0.070%), Ukrainian (26.9%, a difference of 0.090%), Immigrants from Saudi Arabia (26.9%, a difference of 0.10%), and Navajo (26.9%, a difference of 0.16%). Similarly, the demographic groups most similar to Scottish are Tsimshian (27.0%, a difference of 0.0%), Immigrants from Caribbean (27.0%, a difference of 0.030%), Bulgarian (27.0%, a difference of 0.080%), Luxembourger (27.0%, a difference of 0.10%), and Yugoslavian (27.0%, a difference of 0.15%).
| Demographics | Rating | Rank | Family Households with Children |
| Tsimshian | 6.6 /100 | #227 | Tragic 27.0% |
| Scottish | 6.5 /100 | #228 | Tragic 27.0% |
| Immigrants | Caribbean | 6.3 /100 | #229 | Tragic 27.0% |
| Bulgarians | 5.8 /100 | #230 | Tragic 27.0% |
| Luxembourgers | 5.5 /100 | #231 | Tragic 27.0% |
| Yugoslavians | 5.1 /100 | #232 | Tragic 27.0% |
| Immigrants | Italy | 5.0 /100 | #233 | Tragic 27.0% |
| Immigrants | Germany | 4.4 /100 | #234 | Tragic 27.0% |
| Immigrants | Morocco | 4.2 /100 | #235 | Tragic 27.0% |
| Cape Verdeans | 3.6 /100 | #236 | Tragic 26.9% |
| Immigrants | Netherlands | 3.5 /100 | #237 | Tragic 26.9% |
| Moroccans | 3.4 /100 | #238 | Tragic 26.9% |
| Immigrants | Southern Europe | 3.4 /100 | #239 | Tragic 26.9% |
| Immigrants | Bulgaria | 3.3 /100 | #240 | Tragic 26.9% |
| Navajo | 3.2 /100 | #241 | Tragic 26.9% |
| Immigrants | England | 3.2 /100 | #242 | Tragic 26.9% |
| Immigrants | Saudi Arabia | 2.9 /100 | #243 | Tragic 26.9% |
| Ukrainians | 2.9 /100 | #244 | Tragic 26.9% |
| Australians | 2.8 /100 | #245 | Tragic 26.9% |
| Jamaicans | 2.5 /100 | #246 | Tragic 26.9% |
| Potawatomi | 2.2 /100 | #247 | Tragic 26.9% |