Immigrants from Hungary vs Guamanian/Chamorro Householder Income Over 65 years
COMPARE
Immigrants from Hungary
Guamanian/Chamorro
Householder Income Over 65 years
Householder Income Over 65 years Comparison
Immigrants from Hungary
Guamanians/Chamorros
$64,277
HOUSEHOLDER INCOME OVER 65 YEARS
97.0/ 100
METRIC RATING
96th/ 347
METRIC RANK
$63,187
HOUSEHOLDER INCOME OVER 65 YEARS
91.1/ 100
METRIC RATING
116th/ 347
METRIC RANK
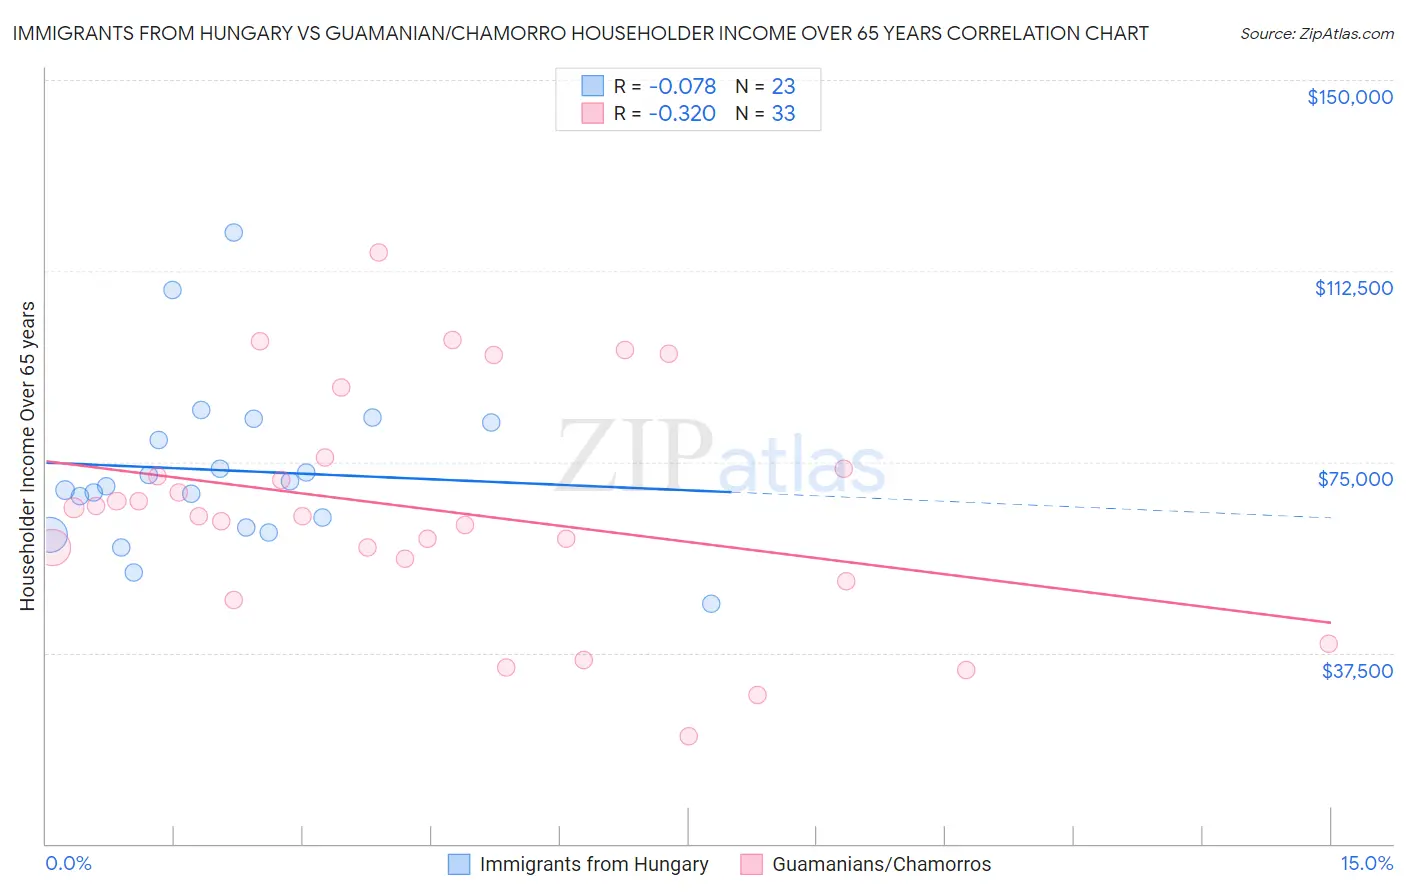
Immigrants from Hungary vs Guamanian/Chamorro Householder Income Over 65 years Correlation Chart
The statistical analysis conducted on geographies consisting of 195,502,299 people shows a slight negative correlation between the proportion of Immigrants from Hungary and household income with householder over the age of 65 in the United States with a correlation coefficient (R) of -0.078 and weighted average of $64,277. Similarly, the statistical analysis conducted on geographies consisting of 221,091,968 people shows a mild negative correlation between the proportion of Guamanians/Chamorros and household income with householder over the age of 65 in the United States with a correlation coefficient (R) of -0.320 and weighted average of $63,187, a difference of 1.7%.
Householder Income Over 65 years Correlation Summary
| Measurement | Immigrants from Hungary | Guamanian/Chamorro |
| Minimum | $47,165 | $21,071 |
| Maximum | $120,169 | $116,094 |
| Range | $73,004 | $95,023 |
| Mean | $73,307 | $65,533 |
| Median | $70,218 | $64,389 |
| Interquartile 25% (IQ1) | $62,092 | $53,785 |
| Interquartile 75% (IQ3) | $82,782 | $74,861 |
| Interquartile Range (IQR) | $20,690 | $21,076 |
| Standard Deviation (Sample) | $16,316 | $22,403 |
| Standard Deviation (Population) | $15,958 | $22,061 |
Demographics Similar to Immigrants from Hungary and Guamanians/Chamorros by Householder Income Over 65 years
In terms of householder income over 65 years, the demographic groups most similar to Immigrants from Hungary are Sri Lankan ($64,201, a difference of 0.12%), Romanian ($64,142, a difference of 0.21%), Assyrian/Chaldean/Syriac ($64,108, a difference of 0.26%), Immigrants from South Eastern Asia ($64,089, a difference of 0.29%), and Immigrants from Italy ($64,065, a difference of 0.33%). Similarly, the demographic groups most similar to Guamanians/Chamorros are Croatian ($63,225, a difference of 0.060%), Immigrants from Saudi Arabia ($63,355, a difference of 0.26%), Immigrants from Serbia ($63,387, a difference of 0.32%), Syrian ($63,494, a difference of 0.49%), and Immigrants from Spain ($63,540, a difference of 0.56%).
| Demographics | Rating | Rank | Householder Income Over 65 years |
| Immigrants | Hungary | 97.0 /100 | #96 | Exceptional $64,277 |
| Sri Lankans | 96.7 /100 | #97 | Exceptional $64,201 |
| Romanians | 96.5 /100 | #98 | Exceptional $64,142 |
| Assyrians/Chaldeans/Syriacs | 96.4 /100 | #99 | Exceptional $64,108 |
| Immigrants | South Eastern Asia | 96.3 /100 | #100 | Exceptional $64,089 |
| Immigrants | Italy | 96.2 /100 | #101 | Exceptional $64,065 |
| Chileans | 95.8 /100 | #102 | Exceptional $63,957 |
| British | 95.7 /100 | #103 | Exceptional $63,940 |
| Immigrants | Cameroon | 95.6 /100 | #104 | Exceptional $63,907 |
| Italians | 95.5 /100 | #105 | Exceptional $63,885 |
| Immigrants | Argentina | 95.5 /100 | #106 | Exceptional $63,885 |
| Pakistanis | 95.3 /100 | #107 | Exceptional $63,844 |
| Palestinians | 95.1 /100 | #108 | Exceptional $63,800 |
| Europeans | 95.0 /100 | #109 | Exceptional $63,779 |
| Immigrants | Zimbabwe | 94.3 /100 | #110 | Exceptional $63,643 |
| Immigrants | Spain | 93.7 /100 | #111 | Exceptional $63,540 |
| Syrians | 93.4 /100 | #112 | Exceptional $63,494 |
| Immigrants | Serbia | 92.7 /100 | #113 | Exceptional $63,387 |
| Immigrants | Saudi Arabia | 92.4 /100 | #114 | Exceptional $63,355 |
| Croatians | 91.4 /100 | #115 | Exceptional $63,225 |
| Guamanians/Chamorros | 91.1 /100 | #116 | Exceptional $63,187 |