Immigrants from Western Asia vs Immigrants from Ecuador Householder Income Ages 45 - 64 years
COMPARE
Immigrants from Western Asia
Immigrants from Ecuador
Householder Income Ages 45 - 64 years
Householder Income Ages 45 - 64 years Comparison
Immigrants from Western Asia
Immigrants from Ecuador
$106,217
HOUSEHOLDER INCOME AGES 45 - 64 YEARS
95.0/ 100
METRIC RATING
118th/ 347
METRIC RANK
$91,462
HOUSEHOLDER INCOME AGES 45 - 64 YEARS
1.2/ 100
METRIC RATING
239th/ 347
METRIC RANK
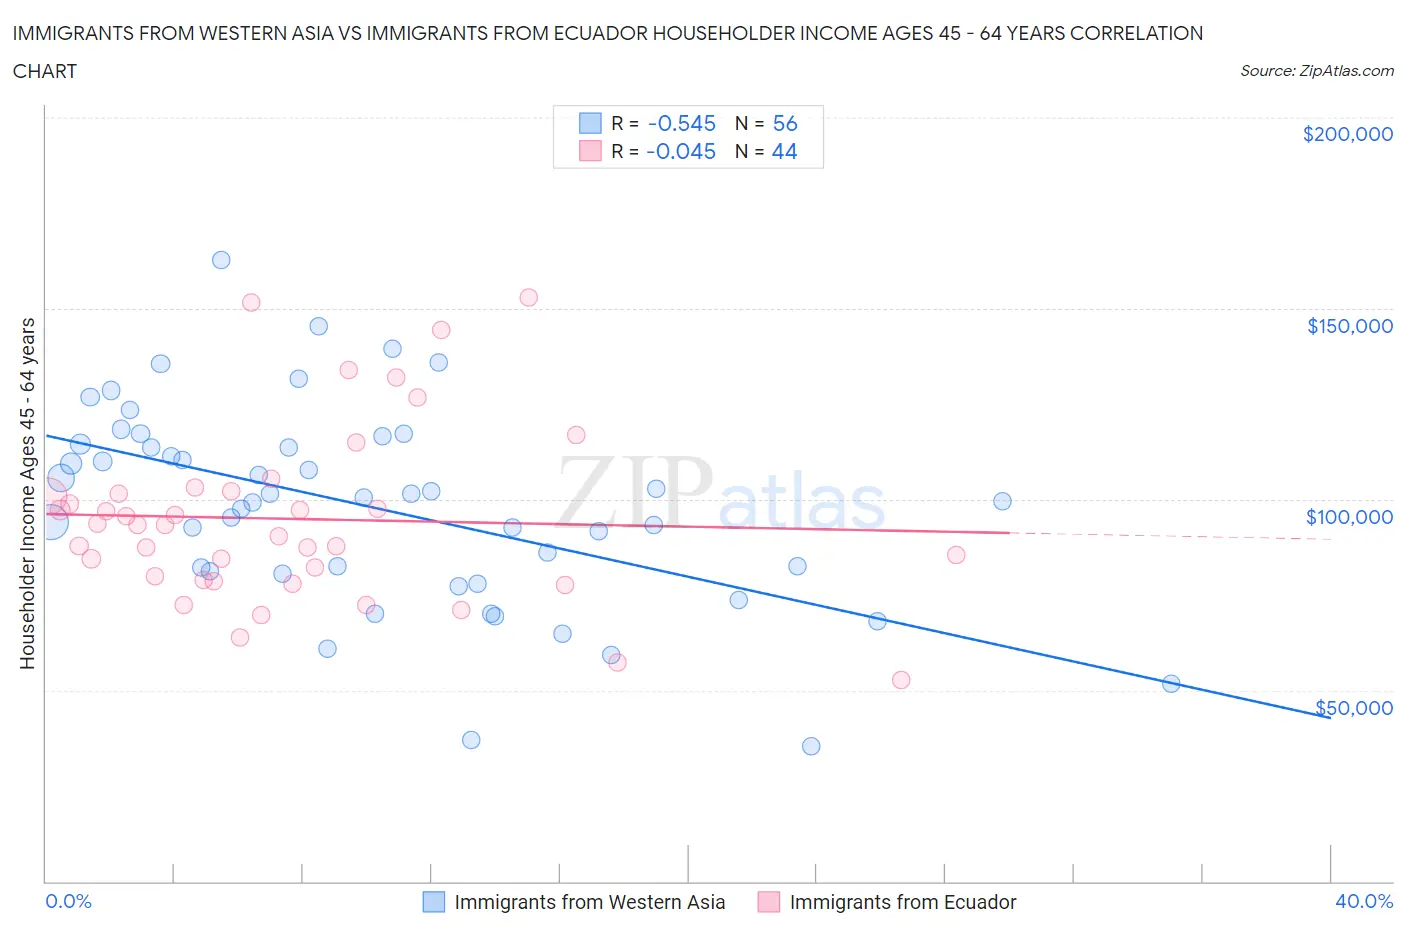
Immigrants from Western Asia vs Immigrants from Ecuador Householder Income Ages 45 - 64 years Correlation Chart
The statistical analysis conducted on geographies consisting of 403,788,110 people shows a substantial negative correlation between the proportion of Immigrants from Western Asia and household income with householder between the ages 45 and 64 in the United States with a correlation coefficient (R) of -0.545 and weighted average of $106,217. Similarly, the statistical analysis conducted on geographies consisting of 270,702,747 people shows no correlation between the proportion of Immigrants from Ecuador and household income with householder between the ages 45 and 64 in the United States with a correlation coefficient (R) of -0.045 and weighted average of $91,462, a difference of 16.1%.
Householder Income Ages 45 - 64 years Correlation Summary
| Measurement | Immigrants from Western Asia | Immigrants from Ecuador |
| Minimum | $35,250 | $52,679 |
| Maximum | $162,741 | $152,835 |
| Range | $127,491 | $100,156 |
| Mean | $97,778 | $94,870 |
| Median | $100,060 | $93,268 |
| Interquartile 25% (IQ1) | $80,918 | $79,452 |
| Interquartile 75% (IQ3) | $113,930 | $101,758 |
| Interquartile Range (IQR) | $33,012 | $22,306 |
| Standard Deviation (Sample) | $26,213 | $22,936 |
| Standard Deviation (Population) | $25,977 | $22,674 |
Similar Demographics by Householder Income Ages 45 - 64 years
Demographics Similar to Immigrants from Western Asia by Householder Income Ages 45 - 64 years
In terms of householder income ages 45 - 64 years, the demographic groups most similar to Immigrants from Western Asia are Albanian ($106,243, a difference of 0.020%), British ($106,264, a difference of 0.040%), Immigrants from Jordan ($106,164, a difference of 0.050%), Immigrants from Kuwait ($106,285, a difference of 0.060%), and Immigrants from Poland ($106,319, a difference of 0.10%).
| Demographics | Rating | Rank | Householder Income Ages 45 - 64 years |
| Immigrants | Vietnam | 95.5 /100 | #111 | Exceptional $106,417 |
| Swedes | 95.4 /100 | #112 | Exceptional $106,377 |
| Europeans | 95.4 /100 | #113 | Exceptional $106,367 |
| Immigrants | Poland | 95.3 /100 | #114 | Exceptional $106,319 |
| Immigrants | Kuwait | 95.2 /100 | #115 | Exceptional $106,285 |
| British | 95.2 /100 | #116 | Exceptional $106,264 |
| Albanians | 95.1 /100 | #117 | Exceptional $106,243 |
| Immigrants | Western Asia | 95.0 /100 | #118 | Exceptional $106,217 |
| Immigrants | Jordan | 94.9 /100 | #119 | Exceptional $106,164 |
| Immigrants | South Eastern Asia | 94.8 /100 | #120 | Exceptional $106,109 |
| Poles | 94.4 /100 | #121 | Exceptional $105,952 |
| Immigrants | North Macedonia | 94.2 /100 | #122 | Exceptional $105,892 |
| Danes | 93.4 /100 | #123 | Exceptional $105,619 |
| Immigrants | Northern Africa | 92.8 /100 | #124 | Exceptional $105,430 |
| Pakistanis | 92.4 /100 | #125 | Exceptional $105,317 |
Demographics Similar to Immigrants from Ecuador by Householder Income Ages 45 - 64 years
In terms of householder income ages 45 - 64 years, the demographic groups most similar to Immigrants from Ecuador are Immigrants from Burma/Myanmar ($91,385, a difference of 0.080%), Trinidadian and Tobagonian ($91,357, a difference of 0.12%), Inupiat ($91,355, a difference of 0.12%), Immigrants from Trinidad and Tobago ($91,347, a difference of 0.13%), and Immigrants from Middle Africa ($91,293, a difference of 0.19%).
| Demographics | Rating | Rank | Householder Income Ages 45 - 64 years |
| Sudanese | 3.5 /100 | #232 | Tragic $93,718 |
| Nepalese | 3.0 /100 | #233 | Tragic $93,355 |
| Immigrants | El Salvador | 2.7 /100 | #234 | Tragic $93,176 |
| Nicaraguans | 2.0 /100 | #235 | Tragic $92,554 |
| Immigrants | Western Africa | 1.8 /100 | #236 | Tragic $92,384 |
| Immigrants | Bangladesh | 1.7 /100 | #237 | Tragic $92,208 |
| Pennsylvania Germans | 1.5 /100 | #238 | Tragic $91,956 |
| Immigrants | Ecuador | 1.2 /100 | #239 | Tragic $91,462 |
| Immigrants | Burma/Myanmar | 1.1 /100 | #240 | Tragic $91,385 |
| Trinidadians and Tobagonians | 1.1 /100 | #241 | Tragic $91,357 |
| Inupiat | 1.1 /100 | #242 | Tragic $91,355 |
| Immigrants | Trinidad and Tobago | 1.1 /100 | #243 | Tragic $91,347 |
| Immigrants | Middle Africa | 1.1 /100 | #244 | Tragic $91,293 |
| Guyanese | 0.9 /100 | #245 | Tragic $90,966 |
| Central Americans | 0.9 /100 | #246 | Tragic $90,951 |