Immigrants from Vietnam vs Eastern European Householder Income Ages 45 - 64 years
COMPARE
Immigrants from Vietnam
Eastern European
Householder Income Ages 45 - 64 years
Householder Income Ages 45 - 64 years Comparison
Immigrants from Vietnam
Eastern Europeans
$106,417
HOUSEHOLDER INCOME AGES 45 - 64 YEARS
95.5/ 100
METRIC RATING
111th/ 347
METRIC RANK
$120,684
HOUSEHOLDER INCOME AGES 45 - 64 YEARS
100.0/ 100
METRIC RATING
19th/ 347
METRIC RANK
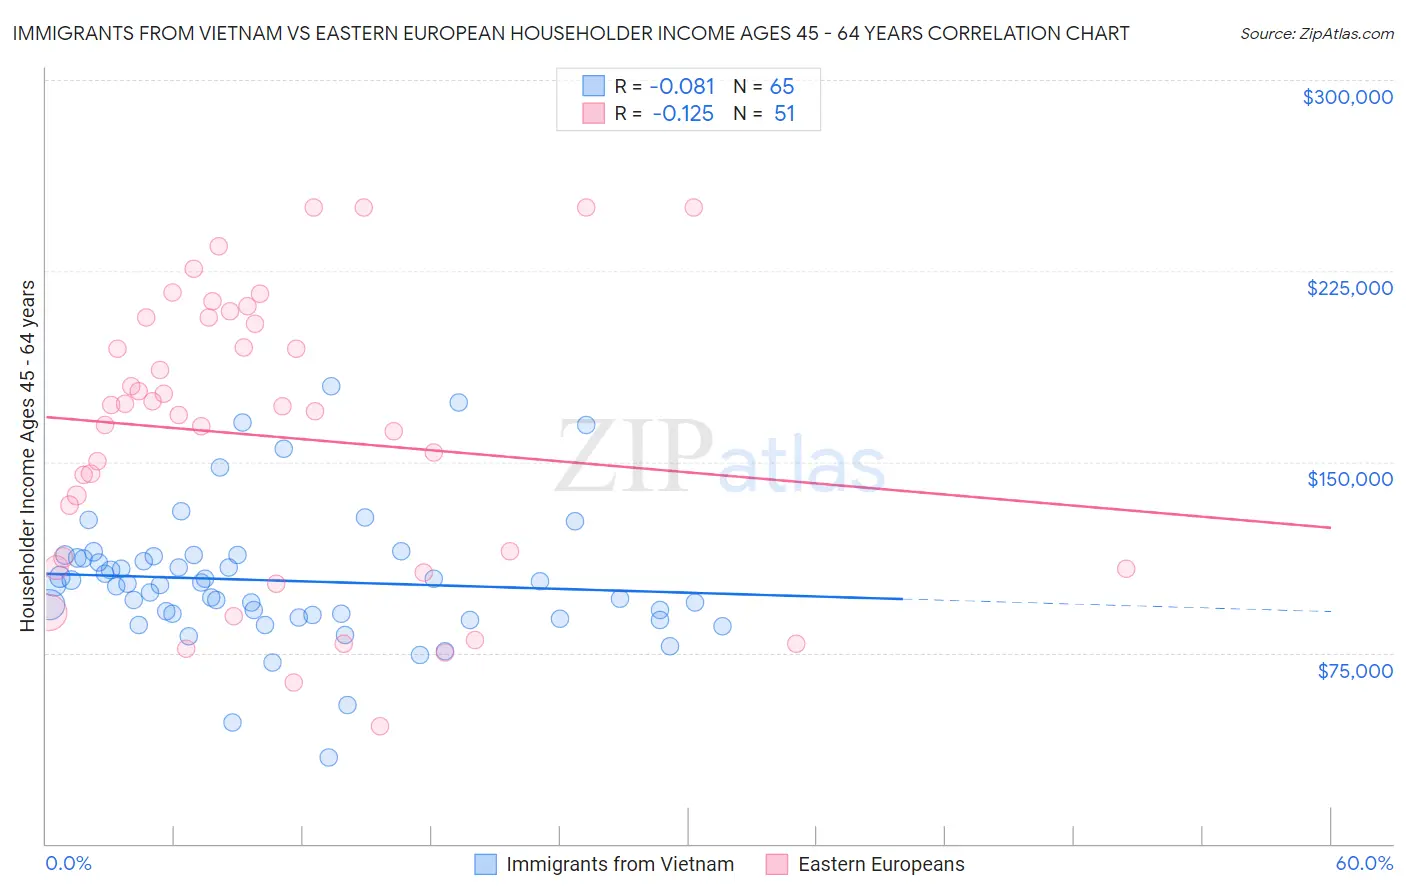
Immigrants from Vietnam vs Eastern European Householder Income Ages 45 - 64 years Correlation Chart
The statistical analysis conducted on geographies consisting of 404,123,735 people shows a slight negative correlation between the proportion of Immigrants from Vietnam and household income with householder between the ages 45 and 64 in the United States with a correlation coefficient (R) of -0.081 and weighted average of $106,417. Similarly, the statistical analysis conducted on geographies consisting of 460,234,248 people shows a poor negative correlation between the proportion of Eastern Europeans and household income with householder between the ages 45 and 64 in the United States with a correlation coefficient (R) of -0.125 and weighted average of $120,684, a difference of 13.4%.
Householder Income Ages 45 - 64 years Correlation Summary
| Measurement | Immigrants from Vietnam | Eastern European |
| Minimum | $34,079 | $46,087 |
| Maximum | $179,835 | $250,001 |
| Range | $145,756 | $203,914 |
| Mean | $103,333 | $160,074 |
| Median | $101,814 | $169,721 |
| Interquartile 25% (IQ1) | $89,317 | $108,414 |
| Interquartile 75% (IQ3) | $112,670 | $206,658 |
| Interquartile Range (IQR) | $23,353 | $98,244 |
| Standard Deviation (Sample) | $26,298 | $55,229 |
| Standard Deviation (Population) | $26,095 | $54,685 |
Similar Demographics by Householder Income Ages 45 - 64 years
Demographics Similar to Immigrants from Vietnam by Householder Income Ages 45 - 64 years
In terms of householder income ages 45 - 64 years, the demographic groups most similar to Immigrants from Vietnam are Swedish ($106,377, a difference of 0.040%), Immigrants from Brazil ($106,470, a difference of 0.050%), European ($106,367, a difference of 0.050%), Immigrants from Poland ($106,319, a difference of 0.090%), and Immigrants from Kuwait ($106,285, a difference of 0.13%).
| Demographics | Rating | Rank | Householder Income Ages 45 - 64 years |
| Immigrants | Ukraine | 96.7 /100 | #104 | Exceptional $107,079 |
| Macedonians | 96.7 /100 | #105 | Exceptional $107,074 |
| Armenians | 96.6 /100 | #106 | Exceptional $107,002 |
| Immigrants | Fiji | 96.5 /100 | #107 | Exceptional $106,952 |
| Zimbabweans | 96.3 /100 | #108 | Exceptional $106,849 |
| Chileans | 95.9 /100 | #109 | Exceptional $106,611 |
| Immigrants | Brazil | 95.6 /100 | #110 | Exceptional $106,470 |
| Immigrants | Vietnam | 95.5 /100 | #111 | Exceptional $106,417 |
| Swedes | 95.4 /100 | #112 | Exceptional $106,377 |
| Europeans | 95.4 /100 | #113 | Exceptional $106,367 |
| Immigrants | Poland | 95.3 /100 | #114 | Exceptional $106,319 |
| Immigrants | Kuwait | 95.2 /100 | #115 | Exceptional $106,285 |
| British | 95.2 /100 | #116 | Exceptional $106,264 |
| Albanians | 95.1 /100 | #117 | Exceptional $106,243 |
| Immigrants | Western Asia | 95.0 /100 | #118 | Exceptional $106,217 |
Demographics Similar to Eastern Europeans by Householder Income Ages 45 - 64 years
In terms of householder income ages 45 - 64 years, the demographic groups most similar to Eastern Europeans are Immigrants from Korea ($121,243, a difference of 0.46%), Burmese ($121,444, a difference of 0.63%), Immigrants from Australia ($119,308, a difference of 1.1%), Immigrants from China ($122,178, a difference of 1.2%), and Immigrants from Eastern Asia ($122,222, a difference of 1.3%).
| Demographics | Rating | Rank | Householder Income Ages 45 - 64 years |
| Immigrants | Israel | 100.0 /100 | #12 | Exceptional $122,893 |
| Immigrants | Ireland | 100.0 /100 | #13 | Exceptional $122,757 |
| Indians (Asian) | 100.0 /100 | #14 | Exceptional $122,343 |
| Immigrants | Eastern Asia | 100.0 /100 | #15 | Exceptional $122,222 |
| Immigrants | China | 100.0 /100 | #16 | Exceptional $122,178 |
| Burmese | 100.0 /100 | #17 | Exceptional $121,444 |
| Immigrants | Korea | 100.0 /100 | #18 | Exceptional $121,243 |
| Eastern Europeans | 100.0 /100 | #19 | Exceptional $120,684 |
| Immigrants | Australia | 100.0 /100 | #20 | Exceptional $119,308 |
| Immigrants | Sri Lanka | 100.0 /100 | #21 | Exceptional $119,094 |
| Immigrants | Belgium | 100.0 /100 | #22 | Exceptional $118,932 |
| Bolivians | 100.0 /100 | #23 | Exceptional $118,871 |
| Immigrants | Japan | 100.0 /100 | #24 | Exceptional $118,498 |
| Asians | 100.0 /100 | #25 | Exceptional $118,426 |
| Immigrants | Sweden | 100.0 /100 | #26 | Exceptional $118,318 |