Immigrants from Vietnam vs Immigrants from Eastern Europe Householder Income Ages 45 - 64 years

COMPARE

Immigrants from Vietnam
Race
Ancestry
AfghanAfricanAlaska NativeAlaskan AthabascanAlbanianAleutAlsatianAmericanApacheArabArapahoArgentineanArmenianAssyrian/Chaldean/SyriacAustralianAustrianBahamianBangladeshiBarbadianBasqueBelgianBelizeanBermudanBhutaneseBlackfeetBolivianBrazilianBritishBritish West IndianBulgarianBurmeseCajunCambodianCanadianCape VerdeanCarpatho RusynCelticCentral AmericanCentral American IndianCherokeeCheyenneChickasawChileanChineseChippewaChoctawColombianColvilleComancheCosta RicanCreeCreekCroatianCrowCubanCypriotCzechCzechoslovakianDanishDelawareDominicanDutchDutch West IndianEastern EuropeanEcuadorianEgyptianEnglishEstonianEthiopianEuropeanFijianFilipinoFinnishFrenchFrench American IndianFrench CanadianGermanGerman RussianGhanaianGreekGuamanian/ChamorroGuatemalanGuyaneseHaitianHmongHonduranHopiHoumaHungarianIcelanderIndian (Asian)IndonesianInupiatIranianIraqiIrishIroquoisIsraeliItalianJamaicanJapaneseJordanianKenyanKiowaKoreanLaotianLatvianLebaneseLiberianLithuanianLumbeeLuxembourgerMacedonianMalaysianMalteseMarshalleseMenomineeMexicanMexican American IndianMongolianMoroccanNative HawaiianNavajoNepaleseNew ZealanderNicaraguanNigerianNorthern EuropeanNorwegianOkinawanOsageOttawaPaiutePakistaniPalestinianPanamanianParaguayanPennsylvania GermanPeruvianPimaPolishPortuguesePotawatomiPuebloPuerto RicanPuget Sound SalishRomanianRussianSalvadoranSamoanScandinavianScotch-IrishScottishSeminoleSenegaleseSerbianShoshoneSierra LeoneanSiouxSlavicSlovakSloveneSomaliSouth AfricanSouth AmericanSouth American IndianSoviet UnionSpaniardSpanishSpanish AmericanSpanish American IndianSri LankanSubsaharan AfricanSudaneseSwedishSwissSyrianTaiwaneseThaiTlingit-HaidaTohono O'OdhamTonganTrinidadian and TobagonianTsimshianTurkishU.S. Virgin IslanderUgandanUkrainianUruguayanUteVenezuelanVietnameseWelshWest IndianYakamaYaquiYugoslavianYumanYup'ikZimbabwean
Immigration
NonimmigrantsImmigrantsAfghanistanAfricaAlbaniaArgentinaArmeniaAsiaAustraliaAustriaBahamasBangladeshBarbadosBelarusBelgiumBelizeBoliviaBosnia and HerzegovinaBrazilBulgariaBurma/MyanmarCabo VerdeCambodiaCameroonCanadaCaribbeanCentral AmericaChileChinaColombiaCongoCosta RicaCroatiaCubaCzechoslovakiaDenmarkDominicaDominican RepublicEastern AfricaEastern AsiaEcuadorEgyptEl SalvadorEnglandEritreaEthiopiaEuropeFijiFranceGermanyGhanaGreeceGrenadaGuatemalaGuyanaHaitiHondurasHong KongHungaryIndiaIndonesiaIranIraqIrelandIsraelItalyJamaicaJapanJordanKazakhstanKenyaKoreaKuwaitLaosLatin AmericaLatviaLebanonLiberiaLithuaniaMalaysiaMexicoMicronesiaMiddle AfricaMoldovaMoroccoNepalNetherlandsNicaraguaNigeriaNorth AmericaNorth MacedoniaNorthern AfricaNorthern EuropeNorwayOceaniaPakistanPanamaPeruPhilippinesPolandPortugalRomaniaRussiaSaudi ArabiaScotlandSenegalSerbiaSierra LeoneSingaporeSomaliaSouth AfricaSouth AmericaSouth Central AsiaSouth Eastern AsiaSouthern EuropeSpainSri LankaSt. Vincent and the GrenadinesSudanSwedenSwitzerlandSyriaTaiwanThailandTrinidad and TobagoTurkeyUgandaUkraineUruguayUzbekistanVenezuelaVietnamWest IndiesWestern AfricaWestern AsiaWestern EuropeYemenZaireZimbabweAzores
Immigrants from Eastern Europe
Race
Ancestry
AfghanAfricanAlaska NativeAlaskan AthabascanAlbanianAleutAlsatianAmericanApacheArabArapahoArgentineanArmenianAssyrian/Chaldean/SyriacAustralianAustrianBahamianBangladeshiBarbadianBasqueBelgianBelizeanBermudanBhutaneseBlackfeetBolivianBrazilianBritishBritish West IndianBulgarianBurmeseCajunCambodianCanadianCape VerdeanCarpatho RusynCelticCentral AmericanCentral American IndianCherokeeCheyenneChickasawChileanChineseChippewaChoctawColombianColvilleComancheCosta RicanCreeCreekCroatianCrowCubanCypriotCzechCzechoslovakianDanishDelawareDominicanDutchDutch West IndianEastern EuropeanEcuadorianEgyptianEnglishEstonianEthiopianEuropeanFijianFilipinoFinnishFrenchFrench American IndianFrench CanadianGermanGerman RussianGhanaianGreekGuamanian/ChamorroGuatemalanGuyaneseHaitianHmongHonduranHopiHoumaHungarianIcelanderIndian (Asian)IndonesianInupiatIranianIraqiIrishIroquoisIsraeliItalianJamaicanJapaneseJordanianKenyanKiowaKoreanLaotianLatvianLebaneseLiberianLithuanianLumbeeLuxembourgerMacedonianMalaysianMalteseMarshalleseMenomineeMexicanMexican American IndianMongolianMoroccanNative HawaiianNavajoNepaleseNew ZealanderNicaraguanNigerianNorthern EuropeanNorwegianOkinawanOsageOttawaPaiutePakistaniPalestinianPanamanianParaguayanPennsylvania GermanPeruvianPimaPolishPortuguesePotawatomiPuebloPuerto RicanPuget Sound SalishRomanianRussianSalvadoranSamoanScandinavianScotch-IrishScottishSeminoleSenegaleseSerbianShoshoneSierra LeoneanSiouxSlavicSlovakSloveneSomaliSouth AfricanSouth AmericanSouth American IndianSoviet UnionSpaniardSpanishSpanish AmericanSpanish American IndianSri LankanSubsaharan AfricanSudaneseSwedishSwissSyrianTaiwaneseThaiTlingit-HaidaTohono O'OdhamTonganTrinidadian and TobagonianTsimshianTurkishU.S. Virgin IslanderUgandanUkrainianUruguayanUteVenezuelanVietnameseWelshWest IndianYakamaYaquiYugoslavianYumanYup'ikZimbabwean
Immigration
NonimmigrantsImmigrantsAfghanistanAfricaAlbaniaArgentinaArmeniaAsiaAustraliaAustriaBahamasBangladeshBarbadosBelarusBelgiumBelizeBoliviaBosnia and HerzegovinaBrazilBulgariaBurma/MyanmarCabo VerdeCambodiaCameroonCanadaCaribbeanCentral AmericaChileChinaColombiaCongoCosta RicaCroatiaCubaCzechoslovakiaDenmarkDominicaDominican RepublicEastern AfricaEastern AsiaEastern EuropeEcuadorEgyptEl SalvadorEnglandEritreaEthiopiaEuropeFijiFranceGermanyGhanaGreeceGrenadaGuatemalaGuyanaHaitiHondurasHong KongHungaryIndiaIndonesiaIranIraqIrelandIsraelItalyJamaicaJapanJordanKazakhstanKenyaKoreaKuwaitLaosLatin AmericaLatviaLebanonLiberiaLithuaniaMalaysiaMexicoMicronesiaMiddle AfricaMoldovaMoroccoNepalNetherlandsNicaraguaNigeriaNorth AmericaNorth MacedoniaNorthern AfricaNorthern EuropeNorwayOceaniaPakistanPanamaPeruPhilippinesPolandPortugalRomaniaRussiaSaudi ArabiaScotlandSenegalSerbiaSierra LeoneSingaporeSomaliaSouth AfricaSouth AmericaSouth Central AsiaSouth Eastern AsiaSouthern EuropeSpainSri LankaSt. Vincent and the GrenadinesSudanSwedenSwitzerlandSyriaTaiwanThailandTrinidad and TobagoTurkeyUgandaUkraineUruguayUzbekistanVenezuelaWest IndiesWestern AfricaWestern AsiaWestern EuropeYemenZaireZimbabweAzores
Householder Income Ages 45 - 64 years
Income
Poverty
Unemployment
Labor Participation
Family Structure
Vehicle Availability
Education Level
Disability

Householder Income Ages 45 - 64 years Comparison

Immigrants from Vietnam

Immigrants from Eastern Europe

Exceptional
Exceptional
$106,417
HOUSEHOLDER INCOME AGES 45 - 64 YEARS
95.5/ 100
METRIC RATING
111th/ 347
METRIC RANK
$109,335
HOUSEHOLDER INCOME AGES 45 - 64 YEARS
98.9/ 100
METRIC RATING
81st/ 347
METRIC RANK

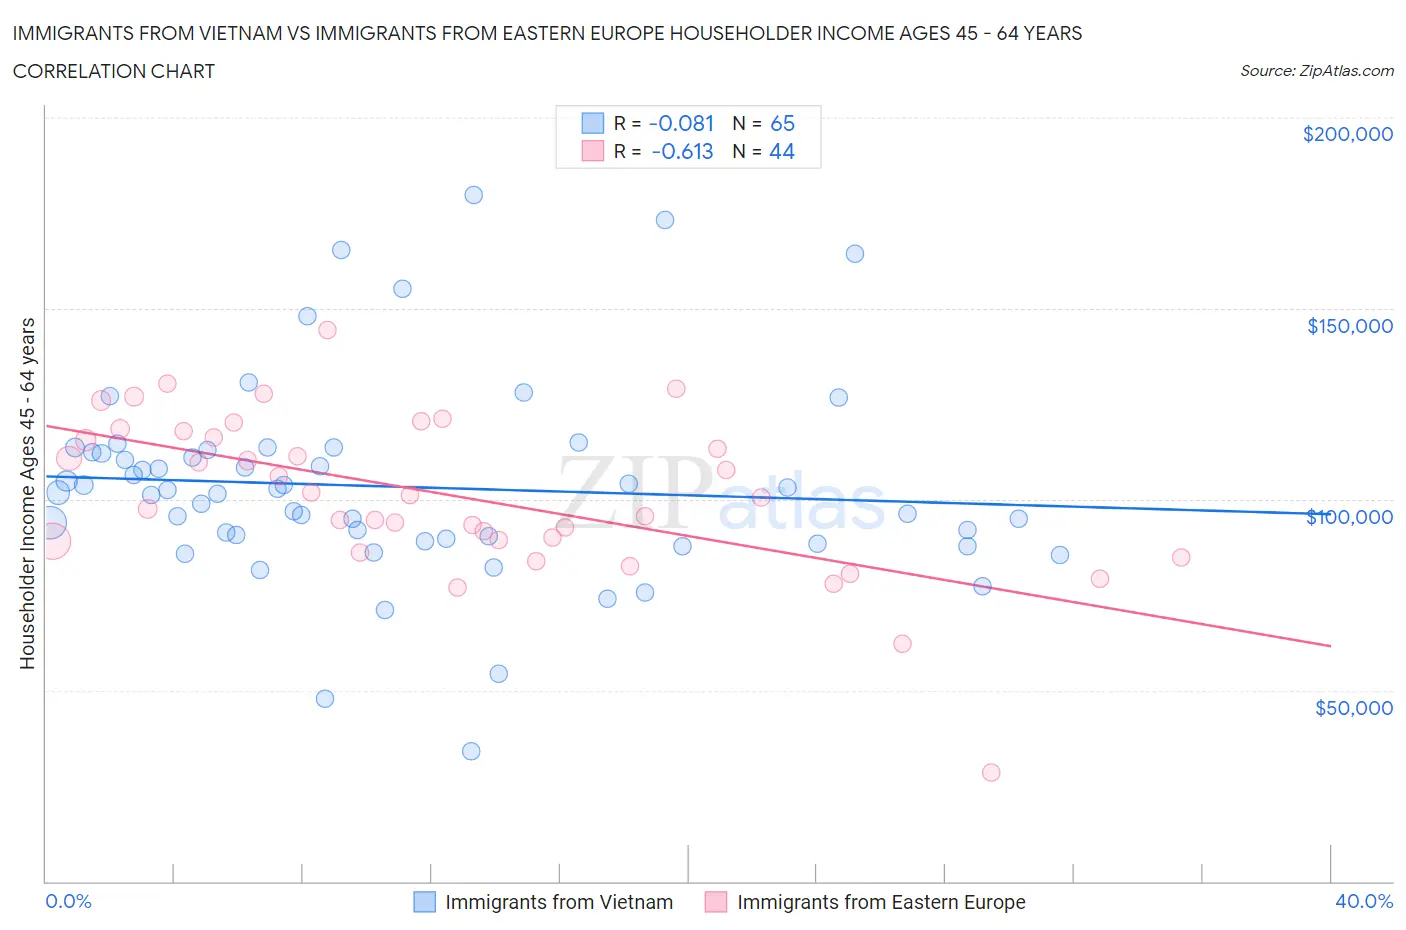
Immigrants from Vietnam vs Immigrants from Eastern Europe Householder Income Ages 45 - 64 years Correlation Chart

The statistical analysis conducted on geographies consisting of 404,123,735 people shows a slight negative correlation between the proportion of Immigrants from Vietnam and household income with householder between the ages 45 and 64 in the United States with a correlation coefficient (R) of -0.081 and weighted average of $106,417. Similarly, the statistical analysis conducted on geographies consisting of 474,661,335 people shows a significant negative correlation between the proportion of Immigrants from Eastern Europe and household income with householder between the ages 45 and 64 in the United States with a correlation coefficient (R) of -0.613 and weighted average of $109,335, a difference of 2.7%.
Immigrants from Vietnam vs Immigrants from Eastern Europe Householder Income Ages 45 - 64 years

Householder Income Ages 45 - 64 years Correlation Summary

MeasurementImmigrants from VietnamImmigrants from Eastern Europe
Minimum$34,079$28,542
Maximum$179,835$144,195
Range$145,756$115,653
Mean$103,333$101,147
Median$101,814$100,823
Interquartile 25% (IQ1)$89,317$89,240
Interquartile 75% (IQ3)$112,670$117,050
Interquartile Range (IQR)$23,353$27,809
Standard Deviation (Sample)$26,298$20,985
Standard Deviation (Population)$26,095$20,746

Similar Demographics by Householder Income Ages 45 - 64 years

Demographics Similar to Immigrants from Vietnam by Householder Income Ages 45 - 64 years

In terms of householder income ages 45 - 64 years, the demographic groups most similar to Immigrants from Vietnam are Swedish ($106,377, a difference of 0.040%), Immigrants from Brazil ($106,470, a difference of 0.050%), European ($106,367, a difference of 0.050%), Immigrants from Poland ($106,319, a difference of 0.090%), and Immigrants from Kuwait ($106,285, a difference of 0.13%).
DemographicsRating | RankHouseholder Income Ages 45 - 64 years
Immigrants | Ukraine
96.7
/100
|
#104
Exceptional
$107,079
Macedonians
96.7
/100
|
#105
Exceptional
$107,074
Armenians
96.6
/100
|
#106
Exceptional
$107,002
Immigrants | Fiji
96.5
/100
|
#107
Exceptional
$106,952
Zimbabweans
96.3
/100
|
#108
Exceptional
$106,849
Chileans
95.9
/100
|
#109
Exceptional
$106,611
Immigrants | Brazil
95.6
/100
|
#110
Exceptional
$106,470
Immigrants | Vietnam
95.5
/100
|
#111
Exceptional
$106,417
Swedes
95.4
/100
|
#112
Exceptional
$106,377
Europeans
95.4
/100
|
#113
Exceptional
$106,367
Immigrants | Poland
95.3
/100
|
#114
Exceptional
$106,319
Immigrants | Kuwait
95.2
/100
|
#115
Exceptional
$106,285
British
95.2
/100
|
#116
Exceptional
$106,264
Albanians
95.1
/100
|
#117
Exceptional
$106,243
Immigrants | Western Asia
95.0
/100
|
#118
Exceptional
$106,217

Demographics Similar to Immigrants from Eastern Europe by Householder Income Ages 45 - 64 years

In terms of householder income ages 45 - 64 years, the demographic groups most similar to Immigrants from Eastern Europe are Immigrants from Bulgaria ($109,379, a difference of 0.040%), Jordanian ($109,376, a difference of 0.040%), Immigrants from Canada ($109,402, a difference of 0.060%), Paraguayan ($109,447, a difference of 0.10%), and Immigrants from England ($109,446, a difference of 0.10%).
DemographicsRating | RankHouseholder Income Ages 45 - 64 years
Immigrants | Egypt
99.2
/100
|
#74
Exceptional
$109,941
South Africans
99.1
/100
|
#75
Exceptional
$109,719
Paraguayans
99.0
/100
|
#76
Exceptional
$109,447
Immigrants | England
99.0
/100
|
#77
Exceptional
$109,446
Immigrants | Canada
99.0
/100
|
#78
Exceptional
$109,402
Immigrants | Bulgaria
98.9
/100
|
#79
Exceptional
$109,379
Jordanians
98.9
/100
|
#80
Exceptional
$109,376
Immigrants | Eastern Europe
98.9
/100
|
#81
Exceptional
$109,335
Immigrants | North America
98.8
/100
|
#82
Exceptional
$109,198
Immigrants | Spain
98.8
/100
|
#83
Exceptional
$109,051
Immigrants | Western Europe
98.6
/100
|
#84
Exceptional
$108,824
Immigrants | Afghanistan
98.6
/100
|
#85
Exceptional
$108,785
Austrians
98.5
/100
|
#86
Exceptional
$108,692
Tongans
98.5
/100
|
#87
Exceptional
$108,643
Romanians
98.5
/100
|
#88
Exceptional
$108,609