Immigrants from Canada vs Salvadoran Median Household Income
COMPARE
Immigrants from Canada
Salvadoran
Median Household Income
Median Household Income Comparison
Immigrants from Canada
Salvadorans
$92,029
MEDIAN HOUSEHOLD INCOME
98.8/ 100
METRIC RATING
88th/ 347
METRIC RANK
$82,449
MEDIAN HOUSEHOLD INCOME
15.4/ 100
METRIC RATING
211th/ 347
METRIC RANK
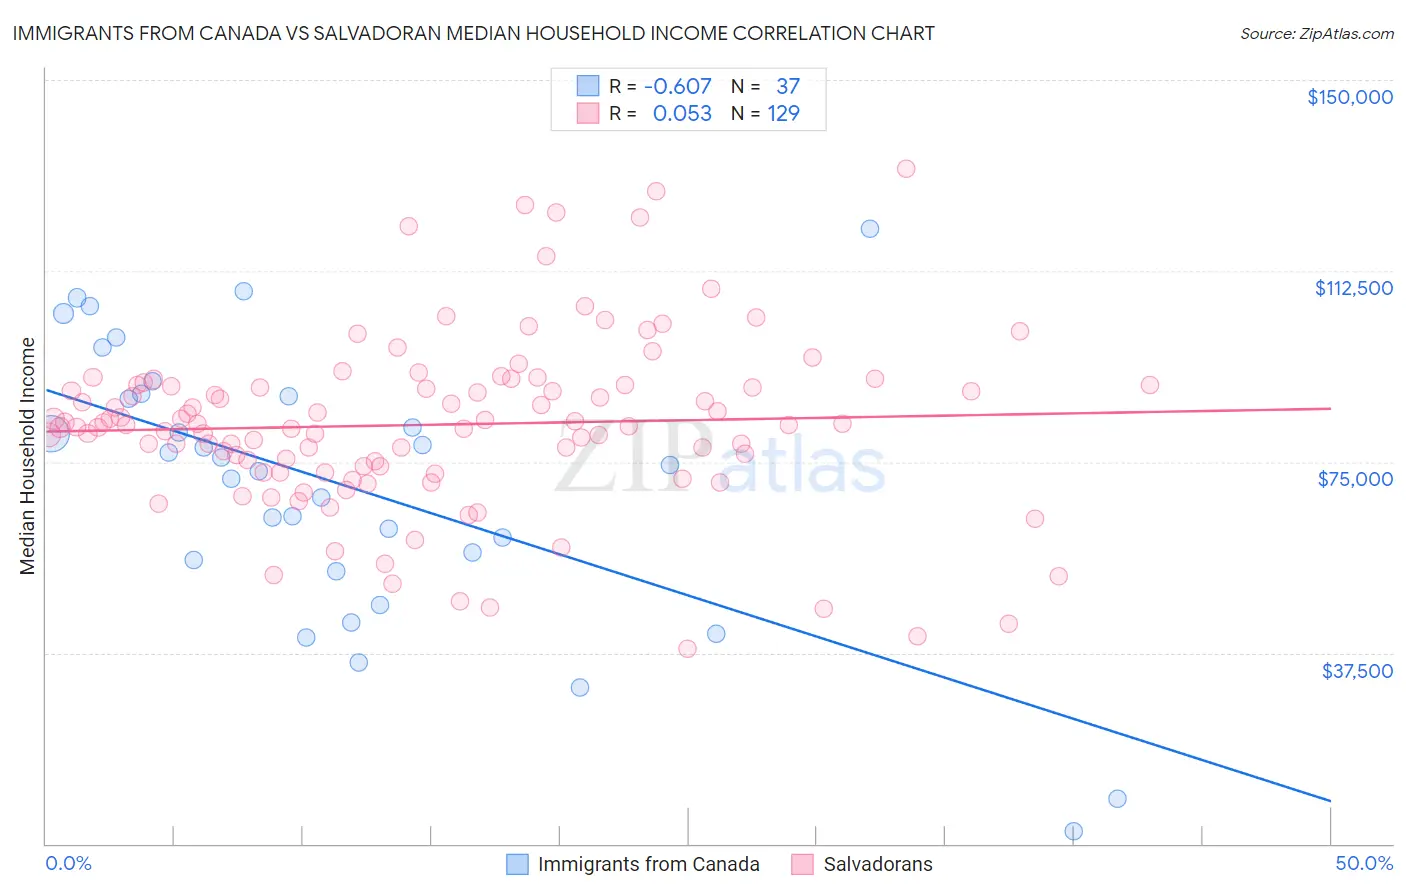
Immigrants from Canada vs Salvadoran Median Household Income Correlation Chart
The statistical analysis conducted on geographies consisting of 459,019,816 people shows a significant negative correlation between the proportion of Immigrants from Canada and median household income in the United States with a correlation coefficient (R) of -0.607 and weighted average of $92,029. Similarly, the statistical analysis conducted on geographies consisting of 398,609,851 people shows a slight positive correlation between the proportion of Salvadorans and median household income in the United States with a correlation coefficient (R) of 0.053 and weighted average of $82,449, a difference of 11.6%.
Median Household Income Correlation Summary
| Measurement | Immigrants from Canada | Salvadoran |
| Minimum | $2,499 | $38,281 |
| Maximum | $120,804 | $132,625 |
| Range | $118,305 | $94,344 |
| Mean | $70,352 | $82,302 |
| Median | $74,400 | $82,350 |
| Interquartile 25% (IQ1) | $54,648 | $73,617 |
| Interquartile 75% (IQ3) | $88,077 | $90,029 |
| Interquartile Range (IQR) | $33,429 | $16,412 |
| Standard Deviation (Sample) | $27,047 | $17,071 |
| Standard Deviation (Population) | $26,679 | $17,005 |
Similar Demographics by Median Household Income
Demographics Similar to Immigrants from Canada by Median Household Income
In terms of median household income, the demographic groups most similar to Immigrants from Canada are Romanian ($91,994, a difference of 0.040%), Assyrian/Chaldean/Syriac ($91,991, a difference of 0.040%), Immigrants from Vietnam ($91,987, a difference of 0.050%), Immigrants from Hungary ($92,094, a difference of 0.070%), and Immigrants from England ($92,098, a difference of 0.080%).
| Demographics | Rating | Rank | Median Household Income |
| Immigrants | Eastern Europe | 99.4 /100 | #81 | Exceptional $93,051 |
| Immigrants | Spain | 99.3 /100 | #82 | Exceptional $92,732 |
| Italians | 99.1 /100 | #83 | Exceptional $92,475 |
| Immigrants | Argentina | 99.1 /100 | #84 | Exceptional $92,417 |
| Immigrants | Croatia | 99.0 /100 | #85 | Exceptional $92,225 |
| Immigrants | England | 98.9 /100 | #86 | Exceptional $92,098 |
| Immigrants | Hungary | 98.9 /100 | #87 | Exceptional $92,094 |
| Immigrants | Canada | 98.8 /100 | #88 | Exceptional $92,029 |
| Romanians | 98.8 /100 | #89 | Exceptional $91,994 |
| Assyrians/Chaldeans/Syriacs | 98.8 /100 | #90 | Exceptional $91,991 |
| Immigrants | Vietnam | 98.8 /100 | #91 | Exceptional $91,987 |
| Immigrants | Western Europe | 98.8 /100 | #92 | Exceptional $91,936 |
| Immigrants | Lebanon | 98.7 /100 | #93 | Exceptional $91,887 |
| Immigrants | North America | 98.7 /100 | #94 | Exceptional $91,860 |
| Armenians | 98.7 /100 | #95 | Exceptional $91,807 |
Demographics Similar to Salvadorans by Median Household Income
In terms of median household income, the demographic groups most similar to Salvadorans are Venezuelan ($82,432, a difference of 0.020%), Nepalese ($82,410, a difference of 0.050%), Immigrants from Uruguay ($82,560, a difference of 0.14%), Immigrants from Iraq ($82,594, a difference of 0.18%), and Panamanian ($82,272, a difference of 0.22%).
| Demographics | Rating | Rank | Median Household Income |
| Immigrants | Africa | 23.8 /100 | #204 | Fair $83,289 |
| Celtics | 22.7 /100 | #205 | Fair $83,193 |
| Immigrants | Kenya | 21.3 /100 | #206 | Fair $83,068 |
| Dutch | 20.3 /100 | #207 | Fair $82,971 |
| French Canadians | 18.7 /100 | #208 | Poor $82,810 |
| Immigrants | Iraq | 16.7 /100 | #209 | Poor $82,594 |
| Immigrants | Uruguay | 16.4 /100 | #210 | Poor $82,560 |
| Salvadorans | 15.4 /100 | #211 | Poor $82,449 |
| Venezuelans | 15.3 /100 | #212 | Poor $82,432 |
| Nepalese | 15.1 /100 | #213 | Poor $82,410 |
| Panamanians | 14.0 /100 | #214 | Poor $82,272 |
| Vietnamese | 13.8 /100 | #215 | Poor $82,248 |
| Yugoslavians | 13.3 /100 | #216 | Poor $82,186 |
| Ecuadorians | 12.5 /100 | #217 | Poor $82,070 |
| Whites/Caucasians | 12.2 /100 | #218 | Poor $82,029 |