Immigrants from Uruguay vs Serbian Unemployment Among Ages 25 to 29 years
COMPARE
Immigrants from Uruguay
Serbian
Unemployment Among Ages 25 to 29 years
Unemployment Among Ages 25 to 29 years Comparison
Immigrants from Uruguay
Serbians
6.5%
UNEMPLOYMENT AMONG AGES 25 TO 29 YEARS
85.7/ 100
METRIC RATING
117th/ 347
METRIC RANK
6.4%
UNEMPLOYMENT AMONG AGES 25 TO 29 YEARS
91.7/ 100
METRIC RATING
98th/ 347
METRIC RANK
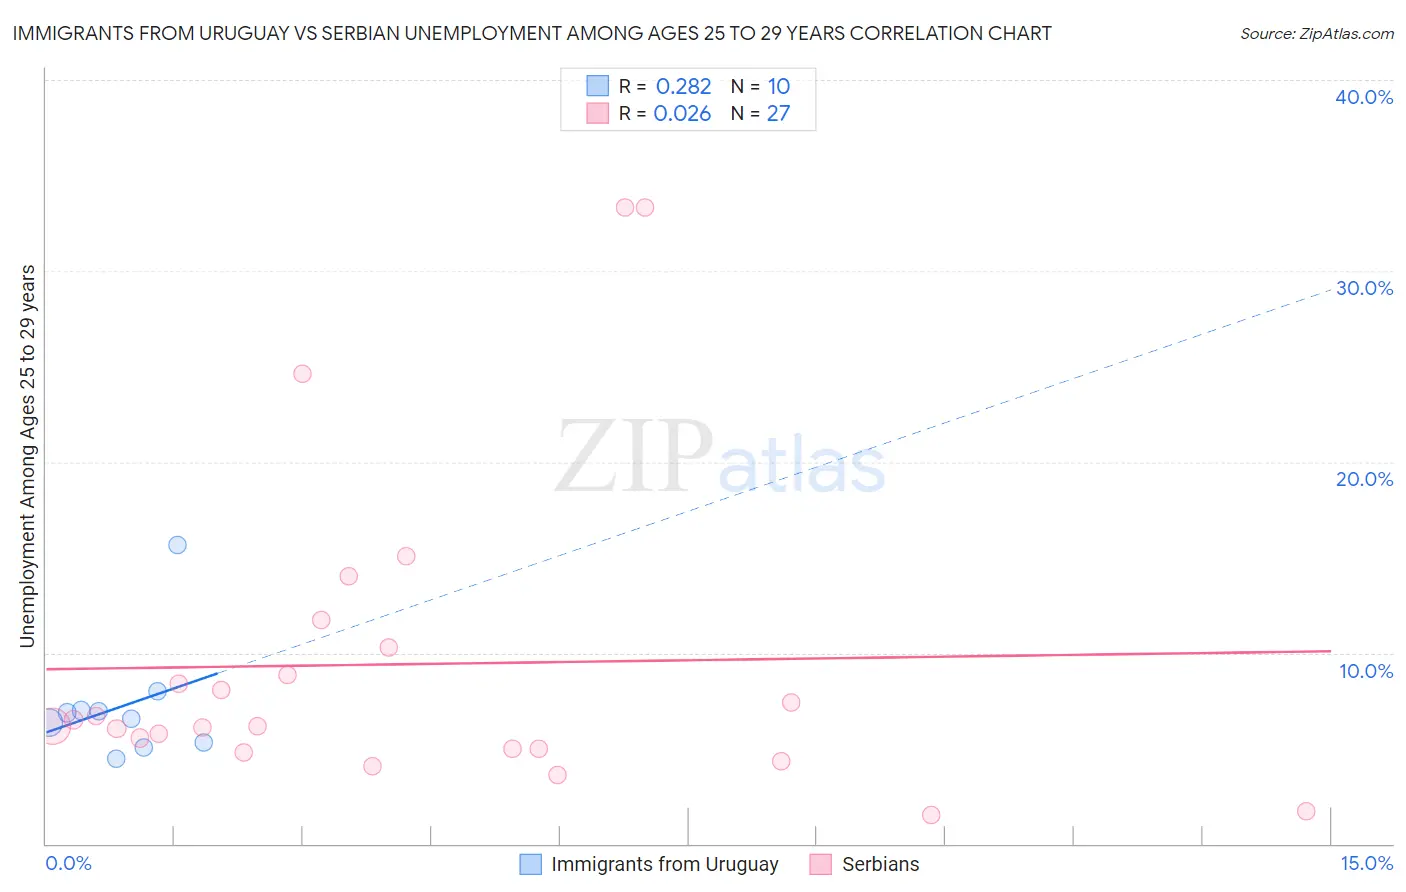
Immigrants from Uruguay vs Serbian Unemployment Among Ages 25 to 29 years Correlation Chart
The statistical analysis conducted on geographies consisting of 130,747,334 people shows a weak positive correlation between the proportion of Immigrants from Uruguay and unemployment rate among population between the ages 25 and 29 in the United States with a correlation coefficient (R) of 0.282 and weighted average of 6.5%. Similarly, the statistical analysis conducted on geographies consisting of 256,984,110 people shows no correlation between the proportion of Serbians and unemployment rate among population between the ages 25 and 29 in the United States with a correlation coefficient (R) of 0.026 and weighted average of 6.4%, a difference of 0.98%.
Unemployment Among Ages 25 to 29 years Correlation Summary
| Measurement | Immigrants from Uruguay | Serbian |
| Minimum | 4.4% | 1.5% |
| Maximum | 15.7% | 33.3% |
| Range | 11.3% | 31.8% |
| Mean | 7.2% | 9.4% |
| Median | 6.7% | 6.2% |
| Interquartile 25% (IQ1) | 5.3% | 5.0% |
| Interquartile 75% (IQ3) | 7.0% | 10.3% |
| Interquartile Range (IQR) | 1.7% | 5.3% |
| Standard Deviation (Sample) | 3.2% | 8.3% |
| Standard Deviation (Population) | 3.0% | 8.2% |
Demographics Similar to Immigrants from Uruguay and Serbians by Unemployment Among Ages 25 to 29 years
In terms of unemployment among ages 25 to 29 years, the demographic groups most similar to Immigrants from Uruguay are Pakistani (6.5%, a difference of 0.020%), Macedonian (6.5%, a difference of 0.050%), German (6.5%, a difference of 0.080%), Immigrants from Egypt (6.5%, a difference of 0.19%), and Immigrants from Nicaragua (6.4%, a difference of 0.24%). Similarly, the demographic groups most similar to Serbians are Immigrants from Eastern Europe (6.4%, a difference of 0.030%), Iraqi (6.4%, a difference of 0.090%), Uruguayan (6.4%, a difference of 0.11%), Immigrants from Ireland (6.4%, a difference of 0.13%), and British (6.4%, a difference of 0.25%).
| Demographics | Rating | Rank | Unemployment Among Ages 25 to 29 years |
| Immigrants | Eastern Europe | 91.9 /100 | #97 | Exceptional 6.4% |
| Serbians | 91.7 /100 | #98 | Exceptional 6.4% |
| Iraqis | 91.3 /100 | #99 | Exceptional 6.4% |
| Uruguayans | 91.2 /100 | #100 | Exceptional 6.4% |
| Immigrants | Ireland | 91.1 /100 | #101 | Exceptional 6.4% |
| British | 90.5 /100 | #102 | Exceptional 6.4% |
| Immigrants | Congo | 90.4 /100 | #103 | Exceptional 6.4% |
| Cypriots | 90.1 /100 | #104 | Exceptional 6.4% |
| Immigrants | Kazakhstan | 89.8 /100 | #105 | Excellent 6.4% |
| Immigrants | Hungary | 89.4 /100 | #106 | Excellent 6.4% |
| Swiss | 88.6 /100 | #107 | Excellent 6.4% |
| Croatians | 88.2 /100 | #108 | Excellent 6.4% |
| Immigrants | Albania | 87.9 /100 | #109 | Excellent 6.4% |
| Europeans | 87.8 /100 | #110 | Excellent 6.4% |
| Immigrants | Colombia | 87.6 /100 | #111 | Excellent 6.4% |
| Immigrants | Nicaragua | 87.5 /100 | #112 | Excellent 6.4% |
| Immigrants | Egypt | 87.1 /100 | #113 | Excellent 6.5% |
| Germans | 86.3 /100 | #114 | Excellent 6.5% |
| Macedonians | 86.1 /100 | #115 | Excellent 6.5% |
| Pakistanis | 85.9 /100 | #116 | Excellent 6.5% |
| Immigrants | Uruguay | 85.7 /100 | #117 | Excellent 6.5% |