Immigrants from Ukraine vs European Householder Income Ages 25 - 44 years
COMPARE
Immigrants from Ukraine
European
Householder Income Ages 25 - 44 years
Householder Income Ages 25 - 44 years Comparison
Immigrants from Ukraine
Europeans
$102,664
HOUSEHOLDER INCOME AGES 25 - 44 YEARS
98.9/ 100
METRIC RATING
85th/ 347
METRIC RANK
$98,310
HOUSEHOLDER INCOME AGES 25 - 44 YEARS
88.9/ 100
METRIC RATING
128th/ 347
METRIC RANK
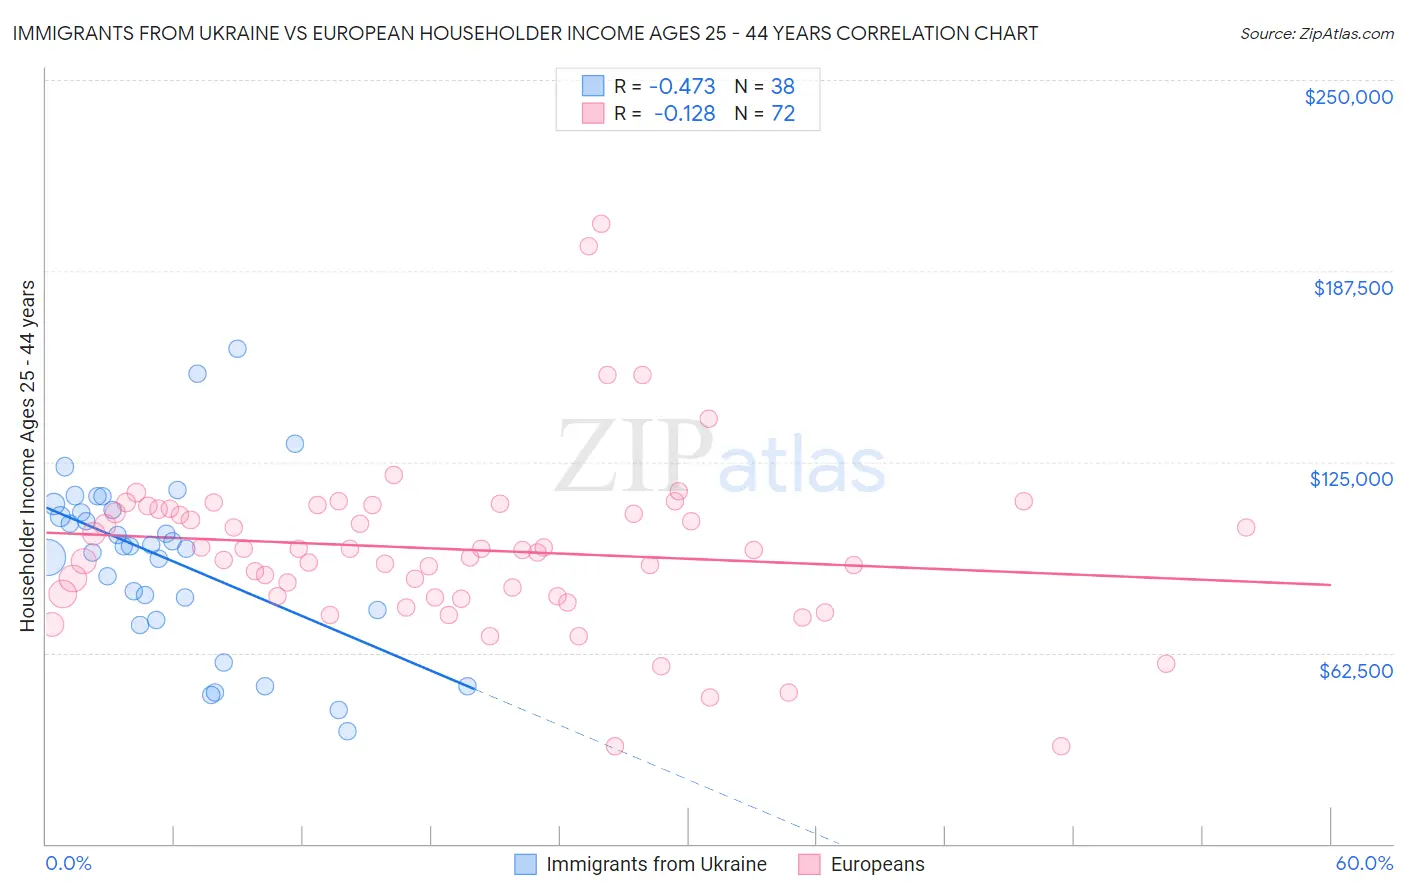
Immigrants from Ukraine vs European Householder Income Ages 25 - 44 years Correlation Chart
The statistical analysis conducted on geographies consisting of 289,246,712 people shows a moderate negative correlation between the proportion of Immigrants from Ukraine and household income with householder between the ages 25 and 44 in the United States with a correlation coefficient (R) of -0.473 and weighted average of $102,664. Similarly, the statistical analysis conducted on geographies consisting of 557,056,371 people shows a poor negative correlation between the proportion of Europeans and household income with householder between the ages 25 and 44 in the United States with a correlation coefficient (R) of -0.128 and weighted average of $98,310, a difference of 4.4%.
Householder Income Ages 25 - 44 years Correlation Summary
| Measurement | Immigrants from Ukraine | European |
| Minimum | $36,667 | $31,731 |
| Maximum | $161,875 | $202,785 |
| Range | $125,208 | $171,054 |
| Mean | $93,208 | $96,402 |
| Median | $97,296 | $96,268 |
| Interquartile 25% (IQ1) | $76,718 | $81,036 |
| Interquartile 75% (IQ3) | $109,168 | $109,601 |
| Interquartile Range (IQR) | $32,451 | $28,565 |
| Standard Deviation (Sample) | $28,398 | $28,192 |
| Standard Deviation (Population) | $28,022 | $27,996 |
Similar Demographics by Householder Income Ages 25 - 44 years
Demographics Similar to Immigrants from Ukraine by Householder Income Ages 25 - 44 years
In terms of householder income ages 25 - 44 years, the demographic groups most similar to Immigrants from Ukraine are Immigrants from Hungary ($102,655, a difference of 0.010%), Immigrants from Western Europe ($102,654, a difference of 0.010%), Immigrants from Canada ($102,616, a difference of 0.050%), Romanian ($102,544, a difference of 0.12%), and Ukrainian ($102,451, a difference of 0.21%).
| Demographics | Rating | Rank | Householder Income Ages 25 - 44 years |
| Immigrants | Bulgaria | 99.3 /100 | #78 | Exceptional $103,423 |
| Armenians | 99.2 /100 | #79 | Exceptional $103,248 |
| Immigrants | Egypt | 99.2 /100 | #80 | Exceptional $103,192 |
| South Africans | 99.2 /100 | #81 | Exceptional $103,160 |
| Immigrants | Serbia | 99.2 /100 | #82 | Exceptional $103,155 |
| Argentineans | 99.1 /100 | #83 | Exceptional $103,111 |
| Immigrants | Philippines | 99.0 /100 | #84 | Exceptional $102,910 |
| Immigrants | Ukraine | 98.9 /100 | #85 | Exceptional $102,664 |
| Immigrants | Hungary | 98.9 /100 | #86 | Exceptional $102,655 |
| Immigrants | Western Europe | 98.9 /100 | #87 | Exceptional $102,654 |
| Immigrants | Canada | 98.9 /100 | #88 | Exceptional $102,616 |
| Romanians | 98.8 /100 | #89 | Exceptional $102,544 |
| Ukrainians | 98.8 /100 | #90 | Exceptional $102,451 |
| Croatians | 98.7 /100 | #91 | Exceptional $102,414 |
| Immigrants | North America | 98.7 /100 | #92 | Exceptional $102,407 |
Demographics Similar to Europeans by Householder Income Ages 25 - 44 years
In terms of householder income ages 25 - 44 years, the demographic groups most similar to Europeans are Serbian ($98,320, a difference of 0.010%), Brazilian ($98,267, a difference of 0.040%), British ($98,359, a difference of 0.050%), Pakistani ($98,401, a difference of 0.090%), and Immigrants from Kuwait ($98,122, a difference of 0.19%).
| Demographics | Rating | Rank | Householder Income Ages 25 - 44 years |
| Peruvians | 91.7 /100 | #121 | Exceptional $98,886 |
| Immigrants | Uzbekistan | 91.5 /100 | #122 | Exceptional $98,849 |
| Palestinians | 91.2 /100 | #123 | Exceptional $98,777 |
| Zimbabweans | 90.3 /100 | #124 | Exceptional $98,586 |
| Pakistanis | 89.3 /100 | #125 | Excellent $98,401 |
| British | 89.1 /100 | #126 | Excellent $98,359 |
| Serbians | 88.9 /100 | #127 | Excellent $98,320 |
| Europeans | 88.9 /100 | #128 | Excellent $98,310 |
| Brazilians | 88.6 /100 | #129 | Excellent $98,267 |
| Immigrants | Kuwait | 87.8 /100 | #130 | Excellent $98,122 |
| Immigrants | Albania | 86.6 /100 | #131 | Excellent $97,929 |
| Immigrants | Zimbabwe | 86.3 /100 | #132 | Excellent $97,880 |
| Tsimshian | 85.8 /100 | #133 | Excellent $97,809 |
| Canadians | 84.5 /100 | #134 | Excellent $97,625 |
| Immigrants | Oceania | 84.5 /100 | #135 | Excellent $97,623 |