Immigrants from Trinidad and Tobago vs Comanche Householder Income Under 25 years
COMPARE
Immigrants from Trinidad and Tobago
Comanche
Householder Income Under 25 years
Householder Income Under 25 years Comparison
Immigrants from Trinidad and Tobago
Comanche
$52,437
HOUSEHOLDER INCOME UNDER 25 YEARS
64.7/ 100
METRIC RATING
164th/ 347
METRIC RANK
$47,518
HOUSEHOLDER INCOME UNDER 25 YEARS
0.0/ 100
METRIC RATING
308th/ 347
METRIC RANK
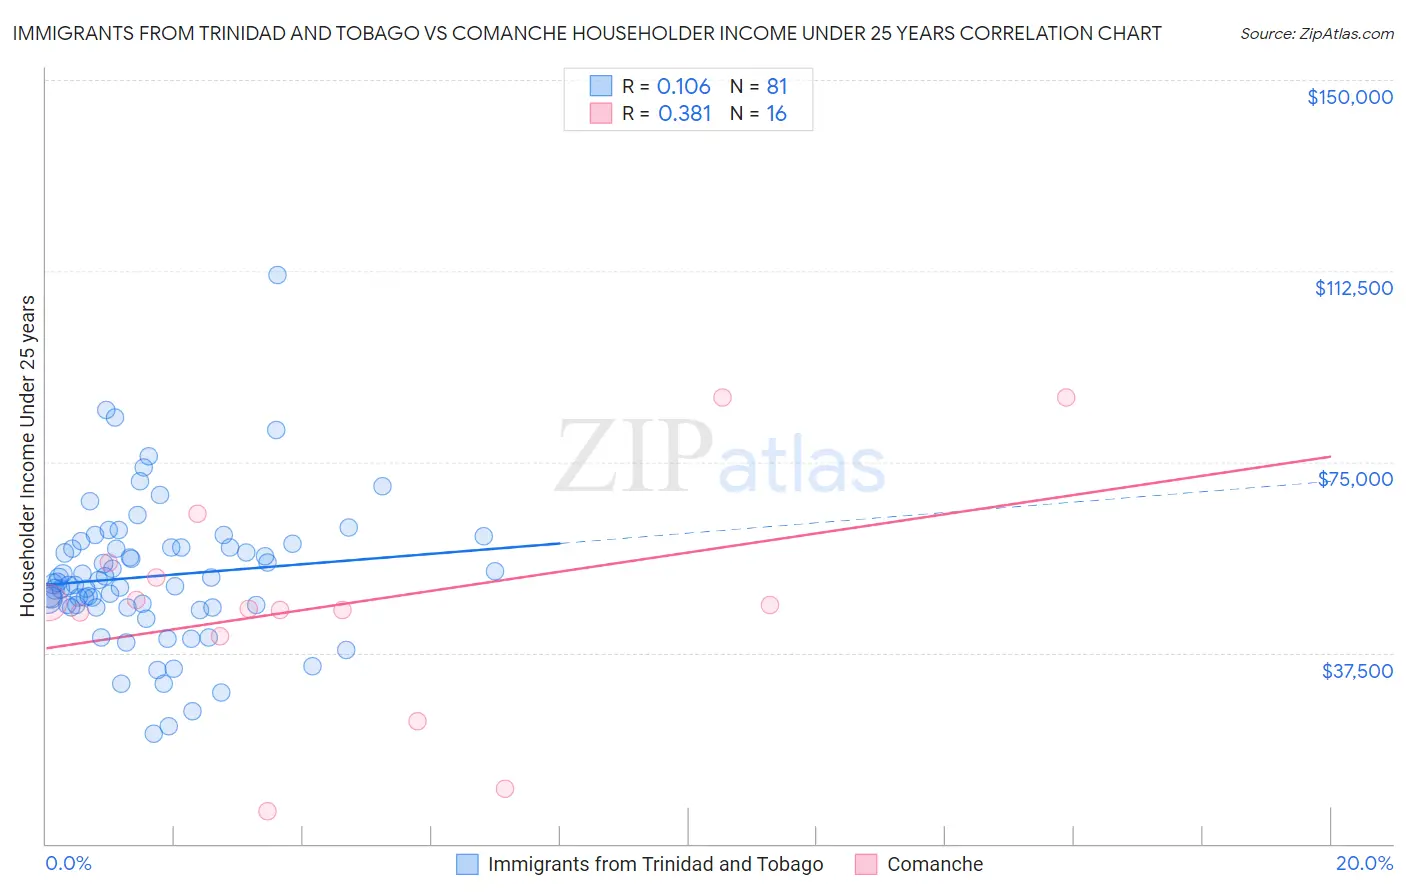
Immigrants from Trinidad and Tobago vs Comanche Householder Income Under 25 years Correlation Chart
The statistical analysis conducted on geographies consisting of 193,741,508 people shows a poor positive correlation between the proportion of Immigrants from Trinidad and Tobago and household income with householder under the age of 25 in the United States with a correlation coefficient (R) of 0.106 and weighted average of $52,437. Similarly, the statistical analysis conducted on geographies consisting of 103,551,593 people shows a mild positive correlation between the proportion of Comanche and household income with householder under the age of 25 in the United States with a correlation coefficient (R) of 0.381 and weighted average of $47,518, a difference of 10.3%.
Householder Income Under 25 years Correlation Summary
| Measurement | Immigrants from Trinidad and Tobago | Comanche |
| Minimum | $21,618 | $6,484 |
| Maximum | $111,719 | $87,727 |
| Range | $90,101 | $81,243 |
| Mean | $52,558 | $47,234 |
| Median | $50,980 | $46,529 |
| Interquartile 25% (IQ1) | $46,433 | $43,131 |
| Interquartile 75% (IQ3) | $58,209 | $53,745 |
| Interquartile Range (IQR) | $11,776 | $10,614 |
| Standard Deviation (Sample) | $14,095 | $21,985 |
| Standard Deviation (Population) | $14,008 | $21,287 |
Similar Demographics by Householder Income Under 25 years
Demographics Similar to Immigrants from Trinidad and Tobago by Householder Income Under 25 years
In terms of householder income under 25 years, the demographic groups most similar to Immigrants from Trinidad and Tobago are Immigrants from Chile ($52,440, a difference of 0.010%), Immigrants from Cambodia ($52,450, a difference of 0.030%), Uruguayan ($52,465, a difference of 0.050%), Polish ($52,407, a difference of 0.060%), and Immigrants from Austria ($52,400, a difference of 0.070%).
| Demographics | Rating | Rank | Householder Income Under 25 years |
| Ghanaians | 72.9 /100 | #157 | Good $52,594 |
| Immigrants | Netherlands | 72.8 /100 | #158 | Good $52,592 |
| Mongolians | 70.2 /100 | #159 | Good $52,540 |
| Immigrants | Turkey | 68.3 /100 | #160 | Good $52,503 |
| Uruguayans | 66.2 /100 | #161 | Good $52,465 |
| Immigrants | Cambodia | 65.4 /100 | #162 | Good $52,450 |
| Immigrants | Chile | 64.8 /100 | #163 | Good $52,440 |
| Immigrants | Trinidad and Tobago | 64.7 /100 | #164 | Good $52,437 |
| Poles | 63.0 /100 | #165 | Good $52,407 |
| Immigrants | Austria | 62.6 /100 | #166 | Good $52,400 |
| Immigrants | Uganda | 61.1 /100 | #167 | Good $52,374 |
| Japanese | 60.5 /100 | #168 | Good $52,365 |
| Canadians | 58.8 /100 | #169 | Average $52,336 |
| Israelis | 58.8 /100 | #170 | Average $52,335 |
| Immigrants | Uruguay | 56.8 /100 | #171 | Average $52,302 |
Demographics Similar to Comanche by Householder Income Under 25 years
In terms of householder income under 25 years, the demographic groups most similar to Comanche are Bangladeshi ($47,589, a difference of 0.15%), U.S. Virgin Islander ($47,448, a difference of 0.15%), Iroquois ($47,380, a difference of 0.29%), Ottawa ($47,366, a difference of 0.32%), and Bermudan ($47,359, a difference of 0.34%).
| Demographics | Rating | Rank | Householder Income Under 25 years |
| Immigrants | Kuwait | 0.0 /100 | #301 | Tragic $48,126 |
| Immigrants | Liberia | 0.0 /100 | #302 | Tragic $47,981 |
| Immigrants | Middle Africa | 0.0 /100 | #303 | Tragic $47,916 |
| Menominee | 0.0 /100 | #304 | Tragic $47,907 |
| Cherokee | 0.0 /100 | #305 | Tragic $47,848 |
| Natives/Alaskans | 0.0 /100 | #306 | Tragic $47,704 |
| Bangladeshis | 0.0 /100 | #307 | Tragic $47,589 |
| Comanche | 0.0 /100 | #308 | Tragic $47,518 |
| U.S. Virgin Islanders | 0.0 /100 | #309 | Tragic $47,448 |
| Iroquois | 0.0 /100 | #310 | Tragic $47,380 |
| Ottawa | 0.0 /100 | #311 | Tragic $47,366 |
| Bermudans | 0.0 /100 | #312 | Tragic $47,359 |
| Delaware | 0.0 /100 | #313 | Tragic $47,159 |
| Chippewa | 0.0 /100 | #314 | Tragic $47,015 |
| Crow | 0.0 /100 | #315 | Tragic $47,012 |