Immigrants from Taiwan vs Dutch Median Family Income
COMPARE
Immigrants from Taiwan
Dutch
Median Family Income
Median Family Income Comparison
Immigrants from Taiwan
Dutch
$136,949
MEDIAN FAMILY INCOME
100.0/ 100
METRIC RATING
2nd/ 347
METRIC RANK
$101,192
MEDIAN FAMILY INCOME
31.9/ 100
METRIC RATING
185th/ 347
METRIC RANK
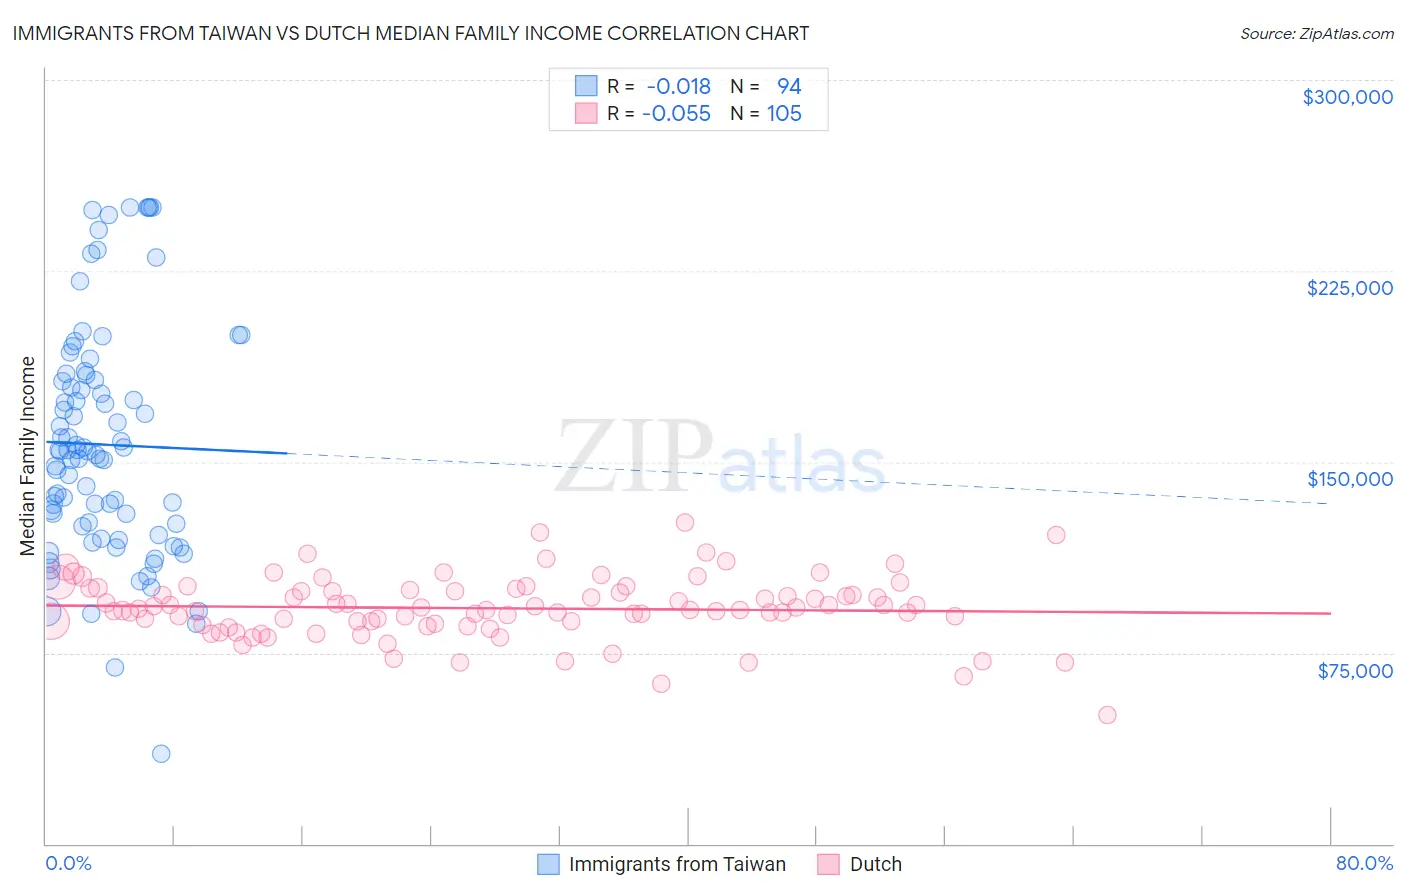
Immigrants from Taiwan vs Dutch Median Family Income Correlation Chart
The statistical analysis conducted on geographies consisting of 298,070,874 people shows no correlation between the proportion of Immigrants from Taiwan and median family income in the United States with a correlation coefficient (R) of -0.018 and weighted average of $136,949. Similarly, the statistical analysis conducted on geographies consisting of 553,300,632 people shows a slight negative correlation between the proportion of Dutch and median family income in the United States with a correlation coefficient (R) of -0.055 and weighted average of $101,192, a difference of 35.3%.
Median Family Income Correlation Summary
| Measurement | Immigrants from Taiwan | Dutch |
| Minimum | $35,382 | $50,679 |
| Maximum | $250,001 | $126,042 |
| Range | $214,619 | $75,363 |
| Mean | $156,781 | $92,505 |
| Median | $154,299 | $92,000 |
| Interquartile 25% (IQ1) | $124,773 | $86,239 |
| Interquartile 75% (IQ3) | $182,305 | $99,471 |
| Interquartile Range (IQR) | $57,532 | $13,232 |
| Standard Deviation (Sample) | $45,464 | $12,293 |
| Standard Deviation (Population) | $45,222 | $12,235 |
Similar Demographics by Median Family Income
Demographics Similar to Immigrants from Taiwan by Median Family Income
In terms of median family income, the demographic groups most similar to Immigrants from Taiwan are Filipino ($138,397, a difference of 1.1%), Immigrants from Singapore ($134,818, a difference of 1.6%), Immigrants from India ($134,028, a difference of 2.2%), Iranian ($133,839, a difference of 2.3%), and Thai ($131,281, a difference of 4.3%).
| Demographics | Rating | Rank | Median Family Income |
| Filipinos | 100.0 /100 | #1 | Exceptional $138,397 |
| Immigrants | Taiwan | 100.0 /100 | #2 | Exceptional $136,949 |
| Immigrants | Singapore | 100.0 /100 | #3 | Exceptional $134,818 |
| Immigrants | India | 100.0 /100 | #4 | Exceptional $134,028 |
| Iranians | 100.0 /100 | #5 | Exceptional $133,839 |
| Thais | 100.0 /100 | #6 | Exceptional $131,281 |
| Immigrants | Hong Kong | 100.0 /100 | #7 | Exceptional $131,067 |
| Immigrants | Iran | 100.0 /100 | #8 | Exceptional $130,894 |
| Okinawans | 100.0 /100 | #9 | Exceptional $129,979 |
| Immigrants | Ireland | 100.0 /100 | #10 | Exceptional $127,584 |
| Immigrants | Israel | 100.0 /100 | #11 | Exceptional $127,430 |
| Cypriots | 100.0 /100 | #12 | Exceptional $127,064 |
| Immigrants | Australia | 100.0 /100 | #13 | Exceptional $126,620 |
| Immigrants | South Central Asia | 100.0 /100 | #14 | Exceptional $125,956 |
| Eastern Europeans | 100.0 /100 | #15 | Exceptional $125,546 |
Demographics Similar to Dutch by Median Family Income
In terms of median family income, the demographic groups most similar to Dutch are Celtic ($101,139, a difference of 0.050%), Tlingit-Haida ($101,092, a difference of 0.10%), Guamanian/Chamorro ($101,061, a difference of 0.13%), Immigrants from Costa Rica ($101,354, a difference of 0.16%), and Immigrants from Portugal ($100,984, a difference of 0.21%).
| Demographics | Rating | Rank | Median Family Income |
| Welsh | 43.3 /100 | #178 | Average $102,151 |
| South Americans | 39.7 /100 | #179 | Fair $101,856 |
| French Canadians | 37.0 /100 | #180 | Fair $101,634 |
| Spaniards | 36.8 /100 | #181 | Fair $101,617 |
| Tsimshian | 35.9 /100 | #182 | Fair $101,543 |
| Kenyans | 34.5 /100 | #183 | Fair $101,417 |
| Immigrants | Costa Rica | 33.7 /100 | #184 | Fair $101,354 |
| Dutch | 31.9 /100 | #185 | Fair $101,192 |
| Celtics | 31.3 /100 | #186 | Fair $101,139 |
| Tlingit-Haida | 30.8 /100 | #187 | Fair $101,092 |
| Guamanians/Chamorros | 30.5 /100 | #188 | Fair $101,061 |
| Immigrants | Portugal | 29.6 /100 | #189 | Fair $100,984 |
| Immigrants | Immigrants | 29.4 /100 | #190 | Fair $100,962 |
| Colombians | 27.2 /100 | #191 | Fair $100,750 |
| Immigrants | Kenya | 26.5 /100 | #192 | Fair $100,679 |