Costa Rican vs Dutch Median Family Income
COMPARE
Costa Rican
Dutch
Median Family Income
Median Family Income Comparison
Costa Ricans
Dutch
$103,989
MEDIAN FAMILY INCOME
66.2/ 100
METRIC RATING
163rd/ 347
METRIC RANK
$101,192
MEDIAN FAMILY INCOME
31.9/ 100
METRIC RATING
185th/ 347
METRIC RANK
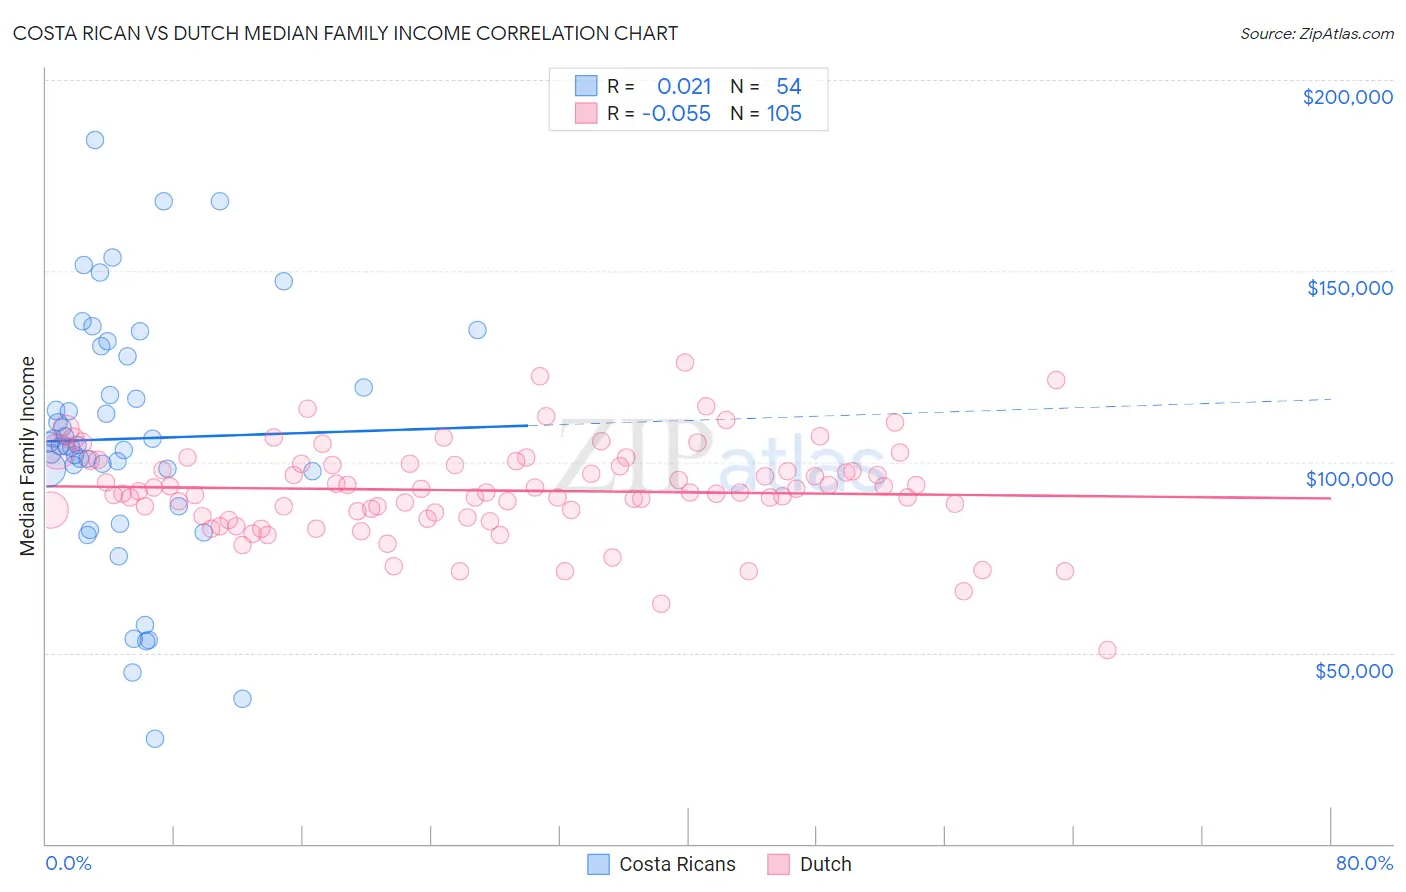
Costa Rican vs Dutch Median Family Income Correlation Chart
The statistical analysis conducted on geographies consisting of 253,398,040 people shows no correlation between the proportion of Costa Ricans and median family income in the United States with a correlation coefficient (R) of 0.021 and weighted average of $103,989. Similarly, the statistical analysis conducted on geographies consisting of 553,300,632 people shows a slight negative correlation between the proportion of Dutch and median family income in the United States with a correlation coefficient (R) of -0.055 and weighted average of $101,192, a difference of 2.8%.
Median Family Income Correlation Summary
| Measurement | Costa Rican | Dutch |
| Minimum | $27,614 | $50,679 |
| Maximum | $184,403 | $126,042 |
| Range | $156,789 | $75,363 |
| Mean | $106,057 | $92,505 |
| Median | $104,255 | $92,000 |
| Interquartile 25% (IQ1) | $97,569 | $86,239 |
| Interquartile 75% (IQ3) | $127,528 | $99,471 |
| Interquartile Range (IQR) | $29,959 | $13,232 |
| Standard Deviation (Sample) | $32,745 | $12,293 |
| Standard Deviation (Population) | $32,441 | $12,235 |
Similar Demographics by Median Family Income
Demographics Similar to Costa Ricans by Median Family Income
In terms of median family income, the demographic groups most similar to Costa Ricans are Immigrants from Sierra Leone ($103,990, a difference of 0.0%), Sierra Leonean ($103,859, a difference of 0.13%), Slovak ($103,729, a difference of 0.25%), Icelander ($104,282, a difference of 0.28%), and Scottish ($104,288, a difference of 0.29%).
| Demographics | Rating | Rank | Median Family Income |
| Basques | 74.4 /100 | #156 | Good $104,760 |
| Moroccans | 71.6 /100 | #157 | Good $104,488 |
| Scandinavians | 70.8 /100 | #158 | Good $104,410 |
| Swiss | 70.7 /100 | #159 | Good $104,396 |
| Scottish | 69.5 /100 | #160 | Good $104,288 |
| Icelanders | 69.4 /100 | #161 | Good $104,282 |
| Immigrants | Sierra Leone | 66.2 /100 | #162 | Good $103,990 |
| Costa Ricans | 66.2 /100 | #163 | Good $103,989 |
| Sierra Leoneans | 64.7 /100 | #164 | Good $103,859 |
| Slovaks | 63.1 /100 | #165 | Good $103,729 |
| English | 62.6 /100 | #166 | Good $103,684 |
| South American Indians | 61.9 /100 | #167 | Good $103,624 |
| Immigrants | Peru | 60.8 /100 | #168 | Good $103,534 |
| Czechoslovakians | 57.6 /100 | #169 | Average $103,273 |
| Immigrants | Uzbekistan | 56.6 /100 | #170 | Average $103,197 |
Demographics Similar to Dutch by Median Family Income
In terms of median family income, the demographic groups most similar to Dutch are Celtic ($101,139, a difference of 0.050%), Tlingit-Haida ($101,092, a difference of 0.10%), Guamanian/Chamorro ($101,061, a difference of 0.13%), Immigrants from Costa Rica ($101,354, a difference of 0.16%), and Immigrants from Portugal ($100,984, a difference of 0.21%).
| Demographics | Rating | Rank | Median Family Income |
| Welsh | 43.3 /100 | #178 | Average $102,151 |
| South Americans | 39.7 /100 | #179 | Fair $101,856 |
| French Canadians | 37.0 /100 | #180 | Fair $101,634 |
| Spaniards | 36.8 /100 | #181 | Fair $101,617 |
| Tsimshian | 35.9 /100 | #182 | Fair $101,543 |
| Kenyans | 34.5 /100 | #183 | Fair $101,417 |
| Immigrants | Costa Rica | 33.7 /100 | #184 | Fair $101,354 |
| Dutch | 31.9 /100 | #185 | Fair $101,192 |
| Celtics | 31.3 /100 | #186 | Fair $101,139 |
| Tlingit-Haida | 30.8 /100 | #187 | Fair $101,092 |
| Guamanians/Chamorros | 30.5 /100 | #188 | Fair $101,061 |
| Immigrants | Portugal | 29.6 /100 | #189 | Fair $100,984 |
| Immigrants | Immigrants | 29.4 /100 | #190 | Fair $100,962 |
| Colombians | 27.2 /100 | #191 | Fair $100,750 |
| Immigrants | Kenya | 26.5 /100 | #192 | Fair $100,679 |