Immigrants from Sweden vs Blackfeet Householder Income Ages 45 - 64 years

COMPARE

Immigrants from Sweden
Race
Ancestry
AfghanAfricanAlaska NativeAlaskan AthabascanAlbanianAleutAlsatianAmericanApacheArabArapahoArgentineanArmenianAssyrian/Chaldean/SyriacAustralianAustrianBahamianBangladeshiBarbadianBasqueBelgianBelizeanBermudanBhutaneseBolivianBrazilianBritishBritish West IndianBulgarianBurmeseCajunCambodianCanadianCape VerdeanCarpatho RusynCelticCentral AmericanCentral American IndianCherokeeCheyenneChickasawChileanChineseChippewaChoctawColombianColvilleComancheCosta RicanCreeCreekCroatianCrowCubanCypriotCzechCzechoslovakianDanishDelawareDominicanDutchDutch West IndianEastern EuropeanEcuadorianEgyptianEnglishEstonianEthiopianEuropeanFijianFilipinoFinnishFrenchFrench American IndianFrench CanadianGermanGerman RussianGhanaianGreekGuamanian/ChamorroGuatemalanGuyaneseHaitianHmongHonduranHopiHoumaHungarianIcelanderIndian (Asian)IndonesianInupiatIranianIraqiIrishIroquoisIsraeliItalianJamaicanJapaneseJordanianKenyanKiowaKoreanLaotianLatvianLebaneseLiberianLithuanianLumbeeLuxembourgerMacedonianMalaysianMalteseMarshalleseMenomineeMexicanMexican American IndianMongolianMoroccanNative HawaiianNavajoNepaleseNew ZealanderNicaraguanNigerianNorthern EuropeanNorwegianOkinawanOsageOttawaPaiutePakistaniPalestinianPanamanianParaguayanPennsylvania GermanPeruvianPimaPolishPortuguesePotawatomiPuebloPuerto RicanPuget Sound SalishRomanianRussianSalvadoranSamoanScandinavianScotch-IrishScottishSeminoleSenegaleseSerbianShoshoneSierra LeoneanSiouxSlavicSlovakSloveneSomaliSouth AfricanSouth AmericanSouth American IndianSoviet UnionSpaniardSpanishSpanish AmericanSpanish American IndianSri LankanSubsaharan AfricanSudaneseSwedishSwissSyrianTaiwaneseThaiTlingit-HaidaTohono O'OdhamTonganTrinidadian and TobagonianTsimshianTurkishU.S. Virgin IslanderUgandanUkrainianUruguayanUteVenezuelanVietnameseWelshWest IndianYakamaYaquiYugoslavianYumanYup'ikZimbabwean
Immigration
NonimmigrantsImmigrantsAfghanistanAfricaAlbaniaArgentinaArmeniaAsiaAustraliaAustriaBahamasBangladeshBarbadosBelarusBelgiumBelizeBoliviaBosnia and HerzegovinaBrazilBulgariaBurma/MyanmarCabo VerdeCambodiaCameroonCanadaCaribbeanCentral AmericaChileChinaColombiaCongoCosta RicaCroatiaCubaCzechoslovakiaDenmarkDominicaDominican RepublicEastern AfricaEastern AsiaEastern EuropeEcuadorEgyptEl SalvadorEnglandEritreaEthiopiaEuropeFijiFranceGermanyGhanaGreeceGrenadaGuatemalaGuyanaHaitiHondurasHong KongHungaryIndiaIndonesiaIranIraqIrelandIsraelItalyJamaicaJapanJordanKazakhstanKenyaKoreaKuwaitLaosLatin AmericaLatviaLebanonLiberiaLithuaniaMalaysiaMexicoMicronesiaMiddle AfricaMoldovaMoroccoNepalNetherlandsNicaraguaNigeriaNorth AmericaNorth MacedoniaNorthern AfricaNorthern EuropeNorwayOceaniaPakistanPanamaPeruPhilippinesPolandPortugalRomaniaRussiaSaudi ArabiaScotlandSenegalSerbiaSierra LeoneSingaporeSomaliaSouth AfricaSouth AmericaSouth Central AsiaSouth Eastern AsiaSouthern EuropeSpainSri LankaSt. Vincent and the GrenadinesSudanSwedenSwitzerlandSyriaTaiwanThailandTrinidad and TobagoTurkeyUgandaUkraineUruguayUzbekistanVenezuelaVietnamWest IndiesWestern AfricaWestern AsiaWestern EuropeYemenZaireZimbabweAzores
Blackfeet
Race
Ancestry
AfghanAfricanAlaska NativeAlaskan AthabascanAlbanianAleutAlsatianAmericanApacheArabArapahoArgentineanArmenianAssyrian/Chaldean/SyriacAustralianAustrianBahamianBangladeshiBarbadianBasqueBelgianBelizeanBermudanBhutaneseBlackfeetBolivianBrazilianBritishBritish West IndianBulgarianBurmeseCajunCambodianCanadianCape VerdeanCarpatho RusynCelticCentral AmericanCentral American IndianCherokeeCheyenneChickasawChileanChineseChippewaChoctawColombianColvilleComancheCosta RicanCreeCreekCroatianCrowCubanCypriotCzechCzechoslovakianDanishDelawareDominicanDutchDutch West IndianEastern EuropeanEcuadorianEgyptianEnglishEstonianEthiopianEuropeanFijianFilipinoFinnishFrenchFrench American IndianFrench CanadianGermanGerman RussianGhanaianGreekGuamanian/ChamorroGuatemalanGuyaneseHaitianHmongHonduranHopiHoumaHungarianIcelanderIndian (Asian)IndonesianInupiatIranianIraqiIrishIroquoisIsraeliItalianJamaicanJapaneseJordanianKenyanKiowaKoreanLaotianLatvianLebaneseLiberianLithuanianLumbeeLuxembourgerMacedonianMalaysianMalteseMarshalleseMenomineeMexicanMexican American IndianMongolianMoroccanNative HawaiianNavajoNepaleseNew ZealanderNicaraguanNigerianNorthern EuropeanNorwegianOkinawanOsageOttawaPaiutePakistaniPalestinianPanamanianParaguayanPennsylvania GermanPeruvianPimaPolishPortuguesePotawatomiPuebloPuerto RicanPuget Sound SalishRomanianRussianSalvadoranSamoanScandinavianScotch-IrishScottishSeminoleSenegaleseSerbianShoshoneSierra LeoneanSiouxSlavicSlovakSloveneSomaliSouth AfricanSouth AmericanSouth American IndianSoviet UnionSpaniardSpanishSpanish AmericanSpanish American IndianSri LankanSubsaharan AfricanSudaneseSwedishSwissSyrianTaiwaneseThaiTlingit-HaidaTohono O'OdhamTonganTrinidadian and TobagonianTsimshianTurkishU.S. Virgin IslanderUgandanUkrainianUruguayanUteVenezuelanVietnameseWelshWest IndianYakamaYaquiYugoslavianYumanYup'ikZimbabwean
Immigration
NonimmigrantsImmigrantsAfghanistanAfricaAlbaniaArgentinaArmeniaAsiaAustraliaAustriaBahamasBangladeshBarbadosBelarusBelgiumBelizeBoliviaBosnia and HerzegovinaBrazilBulgariaBurma/MyanmarCabo VerdeCambodiaCameroonCanadaCaribbeanCentral AmericaChileChinaColombiaCongoCosta RicaCroatiaCubaCzechoslovakiaDenmarkDominicaDominican RepublicEastern AfricaEastern AsiaEastern EuropeEcuadorEgyptEl SalvadorEnglandEritreaEthiopiaEuropeFijiFranceGermanyGhanaGreeceGrenadaGuatemalaGuyanaHaitiHondurasHong KongHungaryIndiaIndonesiaIranIraqIrelandIsraelItalyJamaicaJapanJordanKazakhstanKenyaKoreaKuwaitLaosLatin AmericaLatviaLebanonLiberiaLithuaniaMalaysiaMexicoMicronesiaMiddle AfricaMoldovaMoroccoNepalNetherlandsNicaraguaNigeriaNorth AmericaNorth MacedoniaNorthern AfricaNorthern EuropeNorwayOceaniaPakistanPanamaPeruPhilippinesPolandPortugalRomaniaRussiaSaudi ArabiaScotlandSenegalSerbiaSierra LeoneSingaporeSomaliaSouth AfricaSouth AmericaSouth Central AsiaSouth Eastern AsiaSouthern EuropeSpainSri LankaSt. Vincent and the GrenadinesSudanSwitzerlandSyriaTaiwanThailandTrinidad and TobagoTurkeyUgandaUkraineUruguayUzbekistanVenezuelaVietnamWest IndiesWestern AfricaWestern AsiaWestern EuropeYemenZaireZimbabweAzores
Householder Income Ages 45 - 64 years
Income
Poverty
Unemployment
Labor Participation
Family Structure
Vehicle Availability
Education Level
Disability

Householder Income Ages 45 - 64 years Comparison

Immigrants from Sweden

Blackfeet

Exceptional
Tragic
$118,318
HOUSEHOLDER INCOME AGES 45 - 64 YEARS
100.0/ 100
METRIC RATING
26th/ 347
METRIC RANK
$86,595
HOUSEHOLDER INCOME AGES 45 - 64 YEARS
0.1/ 100
METRIC RATING
285th/ 347
METRIC RANK

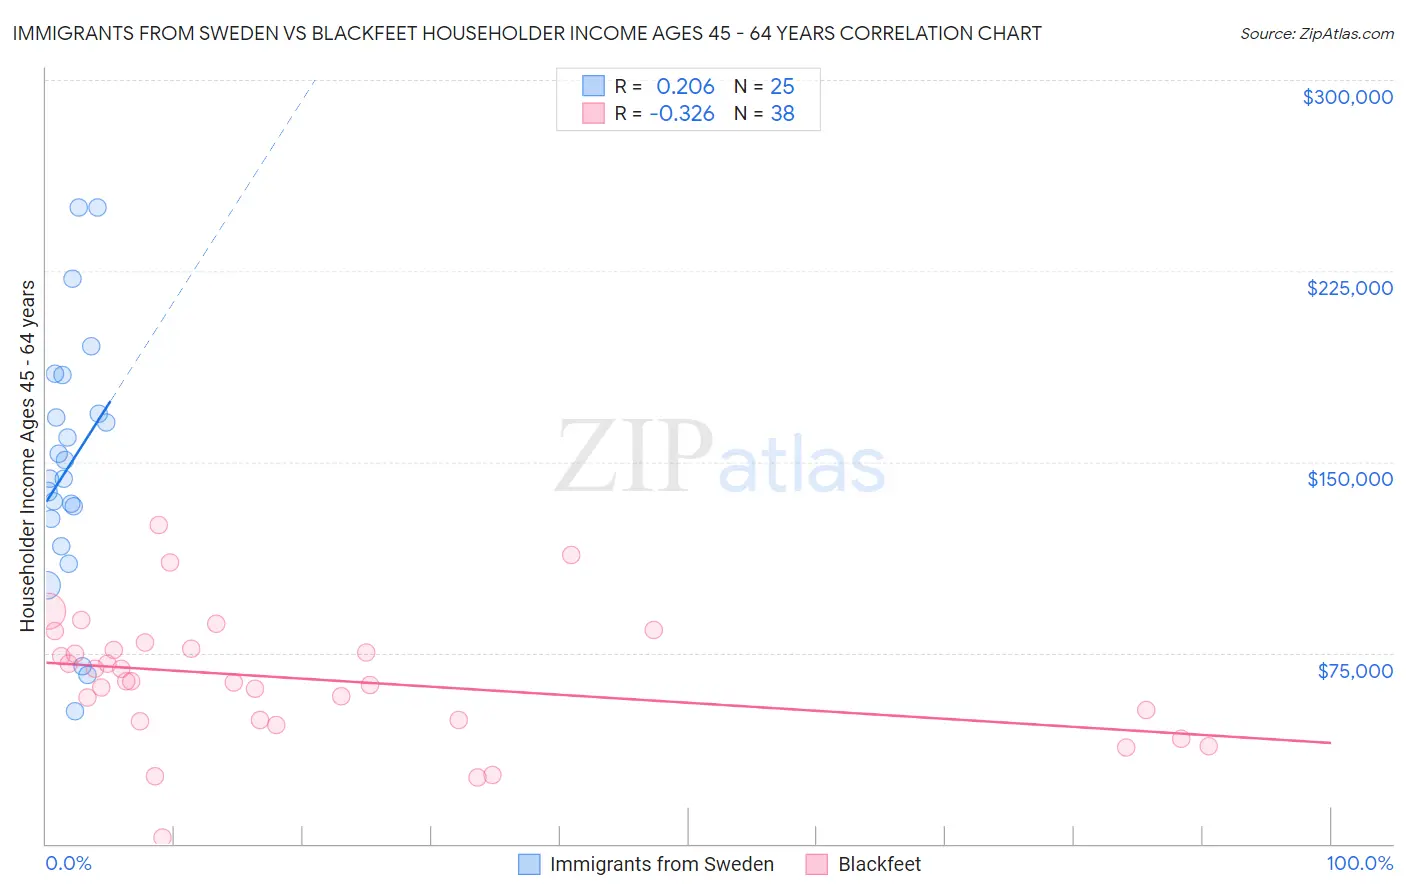
Immigrants from Sweden vs Blackfeet Householder Income Ages 45 - 64 years Correlation Chart

The statistical analysis conducted on geographies consisting of 164,674,181 people shows a weak positive correlation between the proportion of Immigrants from Sweden and household income with householder between the ages 45 and 64 in the United States with a correlation coefficient (R) of 0.206 and weighted average of $118,318. Similarly, the statistical analysis conducted on geographies consisting of 309,065,778 people shows a mild negative correlation between the proportion of Blackfeet and household income with householder between the ages 45 and 64 in the United States with a correlation coefficient (R) of -0.326 and weighted average of $86,595, a difference of 36.6%.
Immigrants from Sweden vs Blackfeet Householder Income Ages 45 - 64 years

Householder Income Ages 45 - 64 years Correlation Summary

MeasurementImmigrants from SwedenBlackfeet
Minimum$52,031$2,499
Maximum$250,001$124,961
Range$197,970$122,462
Mean$148,842$64,472
Median$143,294$63,965
Interquartile 25% (IQ1)$122,314$48,500
Interquartile 75% (IQ3)$176,365$76,463
Interquartile Range (IQR)$54,051$27,963
Standard Deviation (Sample)$50,116$24,942
Standard Deviation (Population)$49,103$24,611

Similar Demographics by Householder Income Ages 45 - 64 years

Demographics Similar to Immigrants from Sweden by Householder Income Ages 45 - 64 years

In terms of householder income ages 45 - 64 years, the demographic groups most similar to Immigrants from Sweden are Asian ($118,426, a difference of 0.090%), Immigrants from Japan ($118,498, a difference of 0.15%), Immigrants from Northern Europe ($117,930, a difference of 0.33%), Turkish ($117,814, a difference of 0.43%), and Bolivian ($118,871, a difference of 0.47%).
DemographicsRating | RankHouseholder Income Ages 45 - 64 years
Eastern Europeans
100.0
/100
|
#19
Exceptional
$120,684
Immigrants | Australia
100.0
/100
|
#20
Exceptional
$119,308
Immigrants | Sri Lanka
100.0
/100
|
#21
Exceptional
$119,094
Immigrants | Belgium
100.0
/100
|
#22
Exceptional
$118,932
Bolivians
100.0
/100
|
#23
Exceptional
$118,871
Immigrants | Japan
100.0
/100
|
#24
Exceptional
$118,498
Asians
100.0
/100
|
#25
Exceptional
$118,426
Immigrants | Sweden
100.0
/100
|
#26
Exceptional
$118,318
Immigrants | Northern Europe
100.0
/100
|
#27
Exceptional
$117,930
Turks
100.0
/100
|
#28
Exceptional
$117,814
Bhutanese
100.0
/100
|
#29
Exceptional
$117,750
Immigrants | Bolivia
100.0
/100
|
#30
Exceptional
$117,731
Immigrants | Asia
100.0
/100
|
#31
Exceptional
$116,566
Russians
100.0
/100
|
#32
Exceptional
$116,328
Chinese
100.0
/100
|
#33
Exceptional
$116,156

Demographics Similar to Blackfeet by Householder Income Ages 45 - 64 years

In terms of householder income ages 45 - 64 years, the demographic groups most similar to Blackfeet are Immigrants from Guatemala ($86,573, a difference of 0.030%), Central American Indian ($86,764, a difference of 0.20%), Bangladeshi ($86,402, a difference of 0.22%), Immigrants from St. Vincent and the Grenadines ($86,394, a difference of 0.23%), and Mexican ($86,816, a difference of 0.25%).
DemographicsRating | RankHouseholder Income Ages 45 - 64 years
Immigrants | Jamaica
0.1
/100
|
#278
Tragic
$87,035
Yakama
0.1
/100
|
#279
Tragic
$86,992
Immigrants | Somalia
0.1
/100
|
#280
Tragic
$86,987
Yaqui
0.1
/100
|
#281
Tragic
$86,914
Senegalese
0.1
/100
|
#282
Tragic
$86,897
Mexicans
0.1
/100
|
#283
Tragic
$86,816
Central American Indians
0.1
/100
|
#284
Tragic
$86,764
Blackfeet
0.1
/100
|
#285
Tragic
$86,595
Immigrants | Guatemala
0.1
/100
|
#286
Tragic
$86,573
Bangladeshis
0.1
/100
|
#287
Tragic
$86,402
Immigrants | St. Vincent and the Grenadines
0.1
/100
|
#288
Tragic
$86,394
Cubans
0.1
/100
|
#289
Tragic
$86,301
Cherokee
0.1
/100
|
#290
Tragic
$86,125
Hispanics or Latinos
0.1
/100
|
#291
Tragic
$86,006
Immigrants | Central America
0.1
/100
|
#292
Tragic
$85,965