Puget Sound Salish vs Immigrants from France Householder Income Ages 25 - 44 years
COMPARE
Puget Sound Salish
Immigrants from France
Householder Income Ages 25 - 44 years
Householder Income Ages 25 - 44 years Comparison
Puget Sound Salish
Immigrants from France
$93,661
HOUSEHOLDER INCOME AGES 25 - 44 YEARS
37.7/ 100
METRIC RATING
181st/ 347
METRIC RANK
$108,257
HOUSEHOLDER INCOME AGES 25 - 44 YEARS
99.9/ 100
METRIC RATING
39th/ 347
METRIC RANK
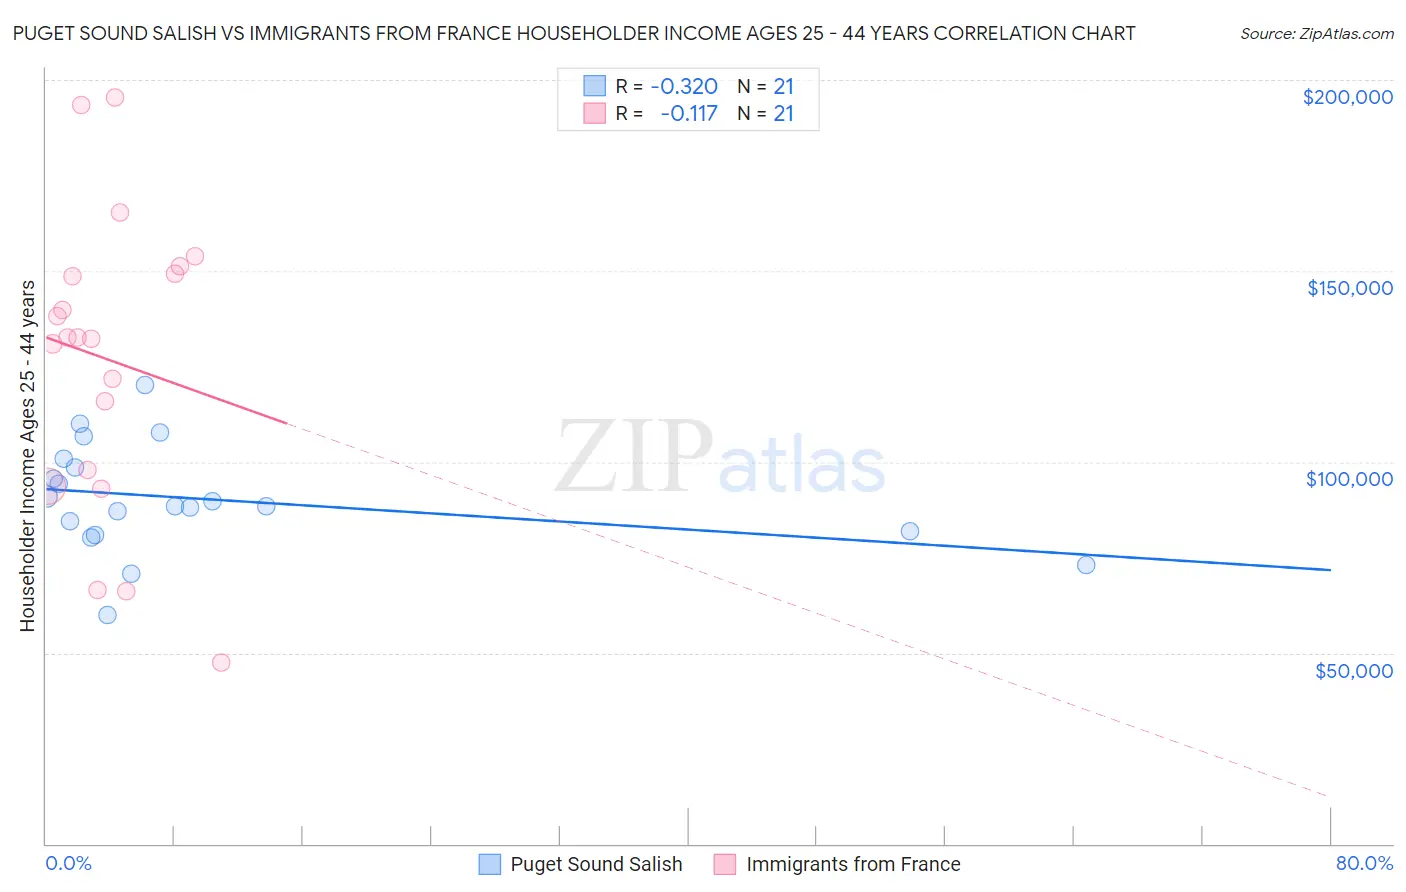
Puget Sound Salish vs Immigrants from France Householder Income Ages 25 - 44 years Correlation Chart
The statistical analysis conducted on geographies consisting of 46,117,384 people shows a mild negative correlation between the proportion of Puget Sound Salish and household income with householder between the ages 25 and 44 in the United States with a correlation coefficient (R) of -0.320 and weighted average of $93,661. Similarly, the statistical analysis conducted on geographies consisting of 287,397,429 people shows a poor negative correlation between the proportion of Immigrants from France and household income with householder between the ages 25 and 44 in the United States with a correlation coefficient (R) of -0.117 and weighted average of $108,257, a difference of 15.6%.
Householder Income Ages 25 - 44 years Correlation Summary
| Measurement | Puget Sound Salish | Immigrants from France |
| Minimum | $60,054 | $47,500 |
| Maximum | $120,094 | $195,321 |
| Range | $60,040 | $147,821 |
| Mean | $90,323 | $126,914 |
| Median | $88,500 | $132,431 |
| Interquartile 25% (IQ1) | $81,286 | $95,699 |
| Interquartile 75% (IQ3) | $99,556 | $150,220 |
| Interquartile Range (IQR) | $18,270 | $54,521 |
| Standard Deviation (Sample) | $14,089 | $38,836 |
| Standard Deviation (Population) | $13,749 | $37,900 |
Similar Demographics by Householder Income Ages 25 - 44 years
Demographics Similar to Puget Sound Salish by Householder Income Ages 25 - 44 years
In terms of householder income ages 25 - 44 years, the demographic groups most similar to Puget Sound Salish are French ($93,665, a difference of 0.0%), Uruguayan ($93,631, a difference of 0.030%), French Canadian ($93,694, a difference of 0.040%), Guamanian/Chamorro ($93,569, a difference of 0.10%), and German ($93,531, a difference of 0.14%).
| Demographics | Rating | Rank | Householder Income Ages 25 - 44 years |
| Colombians | 50.0 /100 | #174 | Average $94,565 |
| English | 48.1 /100 | #175 | Average $94,429 |
| Immigrants | Immigrants | 48.0 /100 | #176 | Average $94,423 |
| Belgians | 45.8 /100 | #177 | Average $94,262 |
| Immigrants | South America | 42.8 /100 | #178 | Average $94,042 |
| French Canadians | 38.2 /100 | #179 | Fair $93,694 |
| French | 37.8 /100 | #180 | Fair $93,665 |
| Puget Sound Salish | 37.7 /100 | #181 | Fair $93,661 |
| Uruguayans | 37.3 /100 | #182 | Fair $93,631 |
| Guamanians/Chamorros | 36.5 /100 | #183 | Fair $93,569 |
| Germans | 36.0 /100 | #184 | Fair $93,531 |
| Immigrants | Eritrea | 35.2 /100 | #185 | Fair $93,466 |
| Sierra Leoneans | 34.8 /100 | #186 | Fair $93,435 |
| Spaniards | 34.0 /100 | #187 | Fair $93,366 |
| Immigrants | Sierra Leone | 30.9 /100 | #188 | Fair $93,115 |
Demographics Similar to Immigrants from France by Householder Income Ages 25 - 44 years
In terms of householder income ages 25 - 44 years, the demographic groups most similar to Immigrants from France are Immigrants from Lithuania ($108,149, a difference of 0.10%), Immigrants from Bolivia ($108,128, a difference of 0.12%), Soviet Union ($108,457, a difference of 0.18%), Australian ($107,912, a difference of 0.32%), and Immigrants from Russia ($108,751, a difference of 0.46%).
| Demographics | Rating | Rank | Householder Income Ages 25 - 44 years |
| Immigrants | Sri Lanka | 100.0 /100 | #32 | Exceptional $109,741 |
| Bhutanese | 100.0 /100 | #33 | Exceptional $109,520 |
| Bolivians | 100.0 /100 | #34 | Exceptional $109,372 |
| Immigrants | Switzerland | 100.0 /100 | #35 | Exceptional $109,185 |
| Latvians | 100.0 /100 | #36 | Exceptional $108,926 |
| Immigrants | Russia | 100.0 /100 | #37 | Exceptional $108,751 |
| Soviet Union | 100.0 /100 | #38 | Exceptional $108,457 |
| Immigrants | France | 99.9 /100 | #39 | Exceptional $108,257 |
| Immigrants | Lithuania | 99.9 /100 | #40 | Exceptional $108,149 |
| Immigrants | Bolivia | 99.9 /100 | #41 | Exceptional $108,128 |
| Australians | 99.9 /100 | #42 | Exceptional $107,912 |
| Immigrants | Malaysia | 99.9 /100 | #43 | Exceptional $107,650 |
| Immigrants | Indonesia | 99.9 /100 | #44 | Exceptional $107,627 |
| Israelis | 99.9 /100 | #45 | Exceptional $107,579 |
| Immigrants | Belarus | 99.9 /100 | #46 | Exceptional $107,393 |